Washington, D.C. 20549
FirstCash, Inc.
You are cordially invited to attend the Annual Meeting of Stockholders to be held at the Company’s corporate offices located at 1600 West 7th Street, Fort Worth, Texas 76102 at 10:00 a.m. CDT on Tuesday,Thursday, June 12, 2018.3, 2021.
The purpose of the meeting is (i) to elect a class of directors to serve a three-year term beginning in 2018,2021, (ii) to vote on the ratification of the selection of RSM US LLP as the independent registered public accounting firm of the Company for the year ending December 31, 2018,2021, and (iii) to vote on a non-binding resolution to approve the compensation of the Company’s named executive officers.
We are pleased to take advantage of the Securities and Exchange Commission rules that allow the Company to furnish proxy materials to stockholders on the internet. These rules allow us to provide our stockholders with the information they need, while reducing the environmental impact of our Annual Meeting and lowering costs. Unless you previously requested a paper copy of our proxy materials, you will receive a Notice Regarding the Availability of Proxy Materials which tells you how to access the materials on the internet.
Whether or not you plan to attend the Annual Meeting, please vote by internet or telephone at your earliest convenience or complete and return your proxy card if you requested a paper copy of our materials. You may choose to attend the meeting and personally cast your votes even if you fill out and return a proxy card.
FirstCash, Inc.
1600 West 7th Street
Fort Worth, Texas 76102
_______________
NOTICE OF ANNUAL MEETING OF STOCKHOLDERS
To Be Held June 12, 20183, 2021
The Annual Meeting of Stockholders of FirstCash, Inc. (the “Company”) will be held at the Company’s corporate offices located at 1600 West 7th Street, Fort Worth, Texas 76102 at 10:00 a.m. CDT on Tuesday, Thursday, June 12, 2018.3, 2021.*
The Annual Meeting is called for the following purposes:
|
| | | | | | | |
| 1. | To elect Messrs. Rick L. Wessel and James H. Graves as directors of the Company for a three-year term beginning in 2018;2021; |
| | |
| 2. | To ratify the selection of RSM US LLP as the independent registered public accounting firm of the Company for the year ending December 31, 2018;2021; |
| | |
| 3. | To vote on a non-binding resolution to approve the compensation of the Company’s named executive officers; |
| | |
| 4. | To transact such other business as may properly come before the meeting. |
Stockholders of record at the close of business on April 13, 201812, 2021 will be entitled to notice of and to vote at the Annual Meeting.
Important Notice Regarding the Availability of Proxy Materials for the Stockholders’ Meeting to be held on June 12, 2018:3, 2021:
The Proxy Statement and the 20172020 Annual Report to Stockholders are available
at the Company’s website and can be accessed at www.firstcash.com, where a link to the Annual Report on Form 10-K is
available on the Investor Relations page of the website (ir.firstcash.com)(investors.firstcash.com).
PLEASE USE INTERNET OR TELEPHONE VOTING OR COMPLETE AND RETURN A PROXY CARD SO THAT YOUR SHARES WILL BE REPRESENTED AT THE ANNUAL MEETING. IF YOU CHOOSE TO ATTEND THE ANNUAL MEETING, YOU MAY REVOKE YOUR PROXY AND PERSONALLY CAST YOUR VOTES AT THE ANNUAL MEETING.
|
| | | | |
| By Order of the Board of Directors, |
| |
| R. Douglas Orr |
| Executive Vice President, Chief Financial Officer, Treasurer and Secretary |
| |
| Fort Worth, Texas | R. Douglas Orr |
April 27, 201823, 2021 | Executive Vice President, Chief Financial Officer,
Treasurer and Secretary
|
* As part of the Company’s precautions regarding the coronavirus or COVID-19, the Company is planning for the possibility that the Annual Meeting may be held by means of remote communication only (i.e., a virtual meeting). If the Company takes this step, or if the time, date or place of the Annual Meeting will be changing, the Company will announce the decision to do so in advance, and details on how to participate will be available on the Investor Relations page of the Company’s website (investors.firstcash.com).
TABLE OF CONTENTS
FirstCash, Inc.
1600 West 7th Street
Fort Worth, Texas 76102
_______________
PROXY STATEMENT
for
Annual Meeting of Stockholders
_______________
GENERAL INFORMATION
This Proxy Statement is being furnished to stockholders in connection with the solicitation of proxies by the Board of Directors (“Board of Directors”) of FirstCash, Inc., a Delaware corporation (“FirstCash” or the “Company”), for use at the 20182021 Annual Meeting of Stockholders of the Company (the “Annual Meeting”) to be held at the Company’s corporate offices located at 1600 West 7th Street, Fort Worth, Texas 7610276102* at 10:00 a.m. CDT, on Tuesday, Thursday, June 12, 2018,3, 2021, and at any adjournments thereof, for the purpose of considering and voting upon the matters set forth in the accompanying Notice of Annual Meeting of Stockholders (the “Notice”). The Company is mailing a printed copy of this Proxy Statement, a proxy card and the 20172020 Annual Report of the Company to certain of its registered stockholders who have not consented to electronic delivery of their proxy materials on or about April 27, 2018,23, 2021, and a Notice of Internet Availability to all other stockholders on or about April 27, 2018.23, 2021.
The close of business on April 13, 201812, 2021 has been fixed as the record date for the determination of stockholders entitled to notice of and to vote at the Annual Meeting and any adjournment thereof. As of the record date, there were 45,415,24241,027,426 shares of the Company’s common stock, par value $.01$.01 per share (“Common Stock”), issued and outstanding. The presence, in person or by proxy, of a majority of the outstanding shares of Common Stock on the record date is necessary to constitute a quorum at the Annual Meeting. Abstentions and broker non-votes (described below) will be counted as present for the purposes of determining the presence of a quorum.
If your shares are held in the name of a broker, bank or other nominee, you are considered the “beneficial holder” of the shares held for you in what is known as “street name.” You are not the “record holder” of such shares. If this is the case, this Proxy Statement has been forwarded to you by your broker, bank or other nominee. As the beneficial holder, you generally have the right to direct your broker, bank or other nominee as to how to vote your shares by providing them with voting instructions.
If you do not provide voting instructions to your broker, bank or other nominee, the voting of your shares by the bank, broker or other nominee is governed by the rules of the New York Stock Exchange (the “NYSE”Nasdaq Global Select Market (“Nasdaq”). These rules allow banks, brokers and other nominees to vote shares in their discretion on “routine” matters for which the “beneficial holder” does not provide voting instructions. On matters considered “non-routine,” banks, brokers and other nominees may not vote shares without your instruction. Shares that banks and brokers are not authorized to vote are referred to as “broker non-votes.”
If you do not instruct your bank, brokerage firm or other nominee in accordance with their directions how to vote your shares prior to the date of the Annual Meeting, your bank, brokerage firm or other nominee cannot vote your shares on the following proposals: “Proposal 1 - Election of Directors” and “Proposal 3 - Advisory Vote to Approve the Compensation of the Company’s Named Executive Officers,” and such shares will be considered “broker non-votes” and will not affect the outcome of these votes. However, your bank or brokerage firm may vote your shares in its discretion on “Proposal 2 - Ratification of Independent Registered Public Accounting Firm.”
* As part of the Company’s precautions regarding the coronavirus or COVID-19, the Company is planning for the possibility that the Annual Meeting may be held by means of remote communication only (i.e., a virtual meeting). If the Company takes this step, or if the time, date or place of the Annual Meeting will be changing, the Company will announce the decision to do so in advance, and details on how to participate will be available on the Investor Relations page of the Company’s website (investors.firstcash.com).
Each share of Common Stock is entitled to one vote on all questions requiring a stockholder vote at the Annual Meeting. The votes required to act on each proposal at the Annual Meeting are summarized below.
Proposal 1 — Election of Directors. A plurality of the votes of the shares of Common Stock present in person or represented by proxy at the Annual Meeting and entitled to vote is required for the approval of the election of directors under Proposal 1 as set forth in the accompanying Notice of Annual Meeting of Stockholders. Stockholders may not cumulate their votes in the election of directors. Abstentions and broker non-votes will have no effect in determining whether the proposal has been approved. The election of directors is also subject to the Company’s Director Election (Majority Voting) Policy, which is described below in the “Corporate Governance, Board Matters and Board Matters”Director Compensation” section of this Proxy Statement.
Proposal 2 — Ratification of Independent Registered Public Accounting Firm. The affirmative vote of a majority of the shares of Common Stock present in person or represented by proxy at the Annual Meeting and entitled to vote is required for the ratification of the selection of the Company’s independent public accountants under Proposal 2 as set forth in the accompanying Notice of Annual Meeting of Stockholders. Since this proposal is considered a routine matter, brokers will be permitted to vote instructed shares without instruction as to this proposal, and there will be no broker non-votes with respect to this proposal. Abstentions will have the same effect as votes against Proposal 2.
Proposal 3 — Advisory Vote to Approve the Compensation of the Company’s Named Executive Officers. The non-binding resolution to approve the compensation of the Company’s named executive officers will be approved if a majority of the shares of Common Stock present in person or represented by proxy at the Annual Meeting and entitled to vote is voted in favor of the proposal. Broker non-votes will have no effect in determining whether the proposal has been approved. Abstentions will have the same effect as votes against Proposal 3.
Stockholder ProposalsProposals.. If any stockholder proposal is properly presented at the Annual Meeting, the stockholder proposal will be approved if it receives the affirmative vote of a majority of the shares of Common Stock present in person or represented by proxy and entitled to vote at the Annual Meeting. Broker non-votes will not be counted as having been entitled to vote on such a proposal, and will have no effect on the outcome of the vote on the proposal. Abstentions will have the same effect as votes against any stockholder proposal.
If you are a stockholder of record, you may vote in person at the Annual Meeting or by proxy without attending the Annual Meeting. You may vote by mail by signing, dating and returning your proxy card in the enclosed prepaid envelope. You may also vote over the Internetinternet or by telephone. The proxy card the Company mails you will instruct you on how to vote over the Internetinternet or by telephone. If you hold your shares in an account through a broker, bank or other nominee in “street name,” you should complete, sign and date the voting instruction card that your broker, bank or nominee provides to you or as your broker or nominee otherwise instructs.
Attendance at the Annual Meeting will be limited to stockholders of the Company as of the record date (or their authorized representatives). If you wish to attend the Annual Meeting in person, you will need to present a valid government-issued photo identification, such as a driver’s license or passport. Beneficial stockholders holding their shares through a broker, bank or other nominee in “street name” will need to bring proof of beneficial ownership as of the record date, such as a recent brokerage account statement, the voting instruction card provided by their broker, bank or other nominee or similar evidence of ownership. Stockholders of record will be verified against an official list available at the registration area. The Company reserves the right to deny admission to anyone who cannot show sufficient proof of stock ownership as of the record date.
All shares represented by properly executed proxies, unless such proxies previously have been revoked, will be voted at the Annual Meeting in accordance with the directions on the proxies. If no direction is indicated, the shares will be voted in accordance with the recommendation of the Board of Directors as follows: (i) TO ELECT MESSRS. RICK L. WESSEL AND JAMES H. GRAVES AS DIRECTORS; (ii) TO RATIFY THE SELECTION OF RSM US LLP AS THE INDEPENDENT REGISTERED PUBLIC ACCOUNTING FIRM OF THE COMPANY FOR THE YEAR ENDING DECEMBER 31, 2018;2021; AND (iii) TO APPROVE THE ADVISORY PROPOSAL ON THE COMPENSATION OF THE COMPANY’S NAMED EXECUTIVE OFFICERS. The designated proxies will vote in their discretion on any other matter that may properly come before the Annual Meeting. At this time, the Company is unaware of any matters, other than as set forth above, that may properly come before the Annual Meeting. The enclosed proxy, even though executed and returned, may be revoked at any time prior to the voting of the proxy (a)(i) by the execution and submission of a revised proxy, (b)(ii) by written notice to the Corporate Secretary of the Company or (c)(iii) by voting in person at the Annual Meeting.
COMPANY OVERVIEW AND ANNUAL REPORT
Company Overview
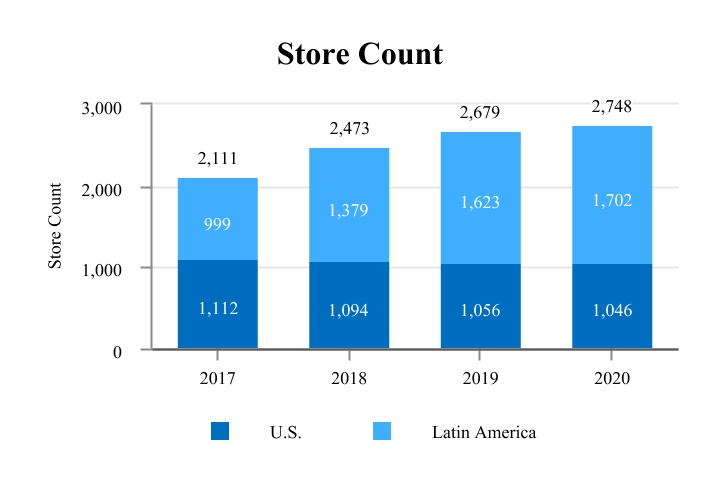
FirstCash is a leading operator of retail pawn stores in the United States and Latin America. As of April 25, 2018, the Company had 2,247 locations, consisting of 1,111 stores in the U.S. and 1,136 stores in Latin America, including Mexico, Guatemala, El Salvador and Colombia. The Company has approximately 17,000 employees, including approximately 8,000 employees located in the U.S. and 9,000 located in Latin America.
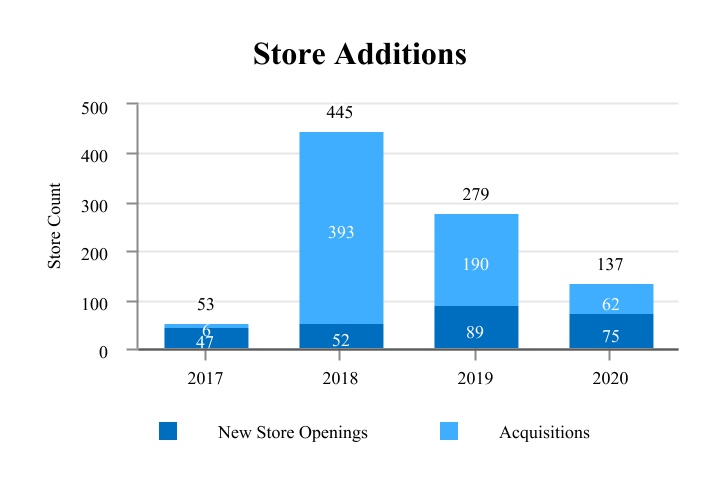
The Company’s primary business is the operation of full-service pawn stores which make small-dollar pawn loans secured by personal property such as consumer electronics, jewelry, power tools, household appliances, sporting goods and musical instruments. These pawn stores generate significant retail sales from the merchandise acquired through collateral forfeitures from pawn loans and over-the-counter purchases of merchandise from customers. In addition, the Company offers small unsecured consumer loans or credit services products. The Company’s strategy is to focus on growing its full-service pawn operations in the United States and Latin America through new store openings and strategic acquisitions as they arise.
On September 1, 2016, the Company completed a stock-for-stock merger of equals (the “Merger”) with Cash America International, Inc. (“Cash America”). In conjunction with the closing of the Merger, the Company changed its name to FirstCash, Inc. and transferred the listing of its common stock from the NASDAQ Global Select Market to the New York Stock Exchange (“NYSE”) under the ticker symbol “FCFS.”
Annual Report
The Annual Report on Form 10-K, covering the Company’s fiscal year ended December 31, 2017,2020, including audited financial statements, is enclosed herewith. The Annual Report on Form 10-K does not form any part of the material for solicitation of proxies.
The Company’s primary website can be accessed at is www.firstcash.com,, where a link to the Annual Report on Form 10-K is available on the Investor Relations page of the website (ir.firstcash.com)(investors.firstcash.com). The Company will provide, without charge, a printed copy of its Annual Report on Form 10-K upon written request to the Corporate Secretary, at 1600 West 7th Street, Fort Worth, Texas 76102. The Company will provide exhibits to its Annual Report on Form 10-K, upon payment of the reasonable expenses incurred by the Company in furnishing such exhibits.
PROPOSAL 1
ELECTION OF DIRECTORS
The Bylaws of the Company provide that the Board of Directors will determine the number of directors but shall consist of at least one director and no more than 15 directors. The stockholders of the Company elect the directors. At each annual meeting of the stockholders of the Company, successors of the class of directors whose term expires at the annual meeting will be elected for a three-year term. Any director elected to fill a vacancy or newly created directorship resulting from an increase in the authorized number of directors shall hold office for a term that shall coincide with the remaining term of that class. In no case will a decrease in the number of directors shorten the term of any incumbent director. Any vacancy on the Board of Directors, however resulting, may be filled by a majority of the directors then in office, even if less than a quorum, or by a sole remaining director.
The stockholders will elect two directors for the coming year for terms of three years.
Unless otherwise instructed or unless authority to vote is withheld, the enclosed proxy will be voted for the election of the nominees listed herein. Although the Board of Directors does not contemplate that the nomineenominees will be unable to serve, if such a situation arises prior to the Annual Meeting, the person named in the enclosed proxy will vote for the election of such other person as may be nominated by the Board of Directors.
The Company hasBoard of Directors currently consists of seven directors following the appointment of which fiveMs. Paula K. Garrett to the Board of Directors effective January 1, 2021. Five of the directors are independent. The current directors are as follows:
|
| | | | | | | | | | | | | | | | | | | |
| Name | | Age | | Principal Occupation | | Independence Status*Status |
| Daniel R. Feehan | | 6770 | | Chairman of the Board, FirstCash, Inc. | | Employee |
| Rick L. Wessel | | 5962 | | Vice-Chairman of the Board and CEO, FirstCash, Inc. | | Employee |
| Daniel E. Berce | | 6467 | | President and CEO, General Motors Financial Company, Inc. | | Independent Director |
| Mikel D. Faulkner | | 6871 | | Former Executive Chairman, of the Board, Nautilus Marine Services PLC | | Lead Independent Director |
| Paula K. Garrett | | 60 | | Vice-President of Finance, Operations and Information System Technology for the Latin America Region, Mary Kay, Inc. | | Independent Director |
| James H. Graves | | 6972 | | Managing Director and Partner, Erwin, Graves & Associates, LP | | Independent Director |
Jorge Montaño | | 72 | | Partner, Guerra Castellanos y Asociados
| | Independent Director |
| Randel G. Owen | | 5962 | | President and CEO, Global Medical Response | | Independent Director |
| |
* | The Board of Directors has determined that, with the exception of Mr. Wessel and Mr. Feehan, all of its directors, including all of the members of the Audit, Compensation, and Nominating and Corporate Governance Committees, are “independent” as defined by the NYSE, the Securities and Exchange Commission (“SEC”) and the Company’s Corporate Governance Guidelines. |
Biographical information for the directors is as follows:
Daniel R. Feehan has served as a directorchairman of the Board of Directors of FirstCash since the MergerCompany’s 2016 merger (the “Merger”) with Cash America International, Inc. (“Cash America”) and previously served as a Cash America director since 1984. Mr. Feehan was Cash America’s executive chairman since November 1, 2015 until the completion of the Merger with Cash America.Merger. Prior to that, Mr. Feehan served as Cash America’s chief executive officer and president from February 2000 through May 2015 and as Cash America’s chief executive officer from May 2015 through October 2015, when he retired from that position. Mr. Feehan served as Cash America’s president and chief operating officer from January 1990 until February 2000, except that he served as chairman and co-chief executive officer of one of Cash America’s subsidiaries from February 1998 to February 1999 before returning to the position of Cash America’s president and chief operating officer. Mr. Feehan became a Cash America director in 1984 and joined Cash America full-time in 1988, serving as its chief financial officer before becoming president and chief operating officer in 1990. Mr. Feehan currently serves as a directorthe chairman at AZZ Inc., a NYSE listed equipment manufacturing company, and Enova International, Inc., an online lending company that was spun off from Cash America in 2014 and is listed on the NYSE, where he has served since 2000 and 2011, respectively. Mr. Feehan previously served as a director at RadioShack Corporation from 2003 through 2015 and Calloway's Nurseries Inc., a multi-store garden center chain, from 1999 to 2016.
Rick L. Wessel has served as vice-chairman of the Board of Directors of the Company since September 2016, as chief executive officer since November 2006 and has been a director since November 1992. Mr. Wessel previously served as president from May 1998 to September 2016, chairman of the board from October 2010 to September 2016, vice chairmanvice-chairman of the board from November 2004 to October 2010 and secretary and treasurer of the Company from May 1992 to November 2006 and the Company’s chief financial officer from May 1992 to December 2002. Prior to February 1992, Mr. Wessel was employed by Price Waterhouse LLP for approximately nine years.
Daniel E. Berce has served as a director of FirstCash since the Merger in 2016 and previously served as a Cash America director since 2006. Mr. Berce has been president and chief executive officer of General Motors Financial Company, Inc. (formerly AmeriCredit Corp.) since its acquisition by General Motors Company in October 2010. Mr. Berce served as AmeriCredit Corp.’s chief executive officer from August 2005 to October 2010, president from April 2003 to October 2010 and vice chairmanvice-chairman and chief financial officer from November 1996 until April 2003. He served as a director at AmeriCredit Corp. from November 1990 to October 2010. Mr. Berce currently serves as a director at AZZ Inc., a NYSE listed equipment manufacturing company, and chairman at Arlington Asset Investment Corp., a NYSE listed investment company.
Mikel D. Faulkner was appointed to the Board of Directors in 2009 and has served as the lead independent director since October 2017. Since 2002,From February 2017 to February 2019, Mr. Faulkner has served as executive chairman of the board of directors of Nautilus Marine Services PLC, an investment company focused on the global offshore services industry and quoted on the London Stock Exchange (AIM). From 2002 to February 2017, Mr. Faulkner served as executive chairman of the board of directors of Global Energy Development PLC, an international oil and gas exploration company, quoted on the London Stock Exchange (AIM). Mr. Faulkner served as chief executive officer of HKN, Inc. (OTCQB:(ASE: HKNI) from 1982 to 2017, chairman from 1991 to 2003 and president and chief executive officer of HKN, Inc. from 2003 to 2017. HKN, Inc., formerly Harken Energy Corporation (NYSE), was an independent energy company.
Paula K. Garrett was appointed to the Board of Directors in January of 2021. Ms. Garrett serves as the vice president of finance, operations and information system technology for the Latin America region of Mary Kay, Inc., a position she has held since 2005. In this role, she leads the financial, operational, technology and other market development functions for all of Mary Kay’s Latin America markets, which include Mexico, Brazil, Argentina, Uruguay, Colombia and Peru. Mary Kay is a multibillion-dollar direct selling beauty company with millions of independent sales force members in nearly 40 markets worldwide. From 1999 to 2004, Ms. Garrett previously held roles at Mary Kay as region controller, Latin America and internal audit project manager. Ms. Garrett’s employment experience also includes service as internal audit manager of Oryx Energy Company from 1998 to 1999 and experience in a progression of accounting and internal audit positions from 1984 to 1998.
James H. Graves has served as a director of FirstCash since the Merger in 2016 and previously served as a Cash America director since 1996. Mr. Graves has served as managing director and partner of Erwin, Graves & Associates, LP, a management consulting firm located in Dallas, Texas, since January 2001. Mr. Graves also served as executive vice president of Financial Strategyfinancial strategy for DeviceFidelity, Inc., a financial services technology company, from March 2008 through September 2012. Mr. Graves served as a director, vice chairmanvice-chairman of the board of directors and chief operating officer of Detwiler, Mitchell & Co., a Boston-based securities research firm, from June 2002 until June 2006. Prior to that, Mr. Graves held various positions, including chief operating officer, with J.C. Bradford & Company, a Nashville-based securities firm. He also worked for Dean Witter Reynolds, Inc. as the head of the energy group and later as head of the industry investment banking groups in New York. Mr. Graves currently serves as a director at Hallmark Financial Services, Inc., a publicly traded insurance company, serving since 1995, Atlantic Capital Bancshares, Inc., a publicly traded bank holding company, serving since 2017 and he previously served as a director of Tristate Capital Holdings, Inc., a publicly traded bank holding company, from 2011 through July 2015. Mr. Graves also serves as a director of various privately-held companies, including a private equity fund and a healthcare technology company.
Ambassador Jorge Montaño has served as a director of FirstCash since June of 2016 and previously served as a director of the Company from June 2010 to July 2013. He is a native resident of Mexico, where he has served in a variety of senior diplomatic positions and business consulting roles. Amb. Montaño currently serves as partner in a Mexico-based public relations and communications firm, Guerra Castellanos y Asociados. During his extensive diplomatic career, he most recently served as the Permanent Representative of Mexico to the United Nations from July 2013 until January 2016. Mr. Montaño was Ambassador to the United States from 1993 to 1995, and had a previous posting as Permanent Representative of Mexico to the United Nations from 1989 to 1992. Between 1982 and 1988, he was Senior Director of Multilateral Affairs in the Ministry of Foreign Affairs. He previously served as Director General for United Nations Specialized Organizations from 1979, the year in which he joined the Foreign Service, until 1982. From 1996 to 2013, he was President of Asesoria y Analisis, a Mexico-based consulting and lobbying firm. In addition, he has served as a professor of International Organizations at the Instituto Tecnológico Autónoma de México from 1996 to 2013.
Randel G. Owen was appointed to the Board of Directors in 2009. In March 2018, Mr. Owen was named president and chief executive officer of Global Medical Response.Response, an industry-leading air, ground, specialty and residential fire services and managed medical transportation organization. From July 1999 to March 2018, he previously held roles as president of ambulatory services, chief financial officer and executive vice president of Envision Healthcare Corporation, (anda large privately-held healthcare company and national hospital-based physician group, and its predecessor companies including AMR and EmCare).EmCare. He was appointed executive vice president and chief financial officer of AMR in March 2003. He joined EmCare in July 1999 and served as executive vice president and chief financial officer from June 2001 to March 2003. Before joining EmCare, Mr. Owen was vice president of Group Financial Operations for PhyCor, Inc. from 1995 to 1999. Mr. Owen has more than 30 years of financial experience in the health care industry.
There are no family relationships between any director or executive officers.
Director Terms
The seven directors are divided into three classes. At each annual meeting of stockholders, one class is elected to hold office for a term of three years. Directors serve until the earlier of (i) their death, resignation, retirement, removal or disqualification, or (ii) until their successor is elected and qualified. The directors standing for election at the Annual Meeting are Messrs. Rick L. Wessel and James H. Graves. Mr. Daniel R. Feehan and Amb. Jorge MontañoMs. Paula K. Garrett will next stand for election in 2019 and2022. Messrs. Daniel E. Berce, Mikel D. Faulkner and Randel G. Owen will next stand for election in 2020.2023.
Required Vote
Proxies will be voted for the election of Messrs. Rick L. Wessel and James H. Graves as directors of the Company unless otherwise specified in the proxy. A plurality of the votes cast by the holders of shares of Common Stock present, in person or represented by proxy at the Annual Meeting will be necessary to elect the nominees as directors. If, for any reason, any nominee is unable or unwilling to serve, the proxies will be voted for a substitute nominee who will be designated by the Board of Directors at the Annual Meeting. Stockholders may abstain from voting by marking the appropriate boxes on the accompanying proxy. Abstentions will be counted separately and used for purposes of calculating whether a quorum is present at the Annual Meeting. The Company has adopted a voting policy for non-contested director elections, which is described below in the “Corporate Governance, and Board Matters and Director Compensation” section.
Recommendation of the Board of Directors
Based on the respective nominees’ experience, the Nominating and Corporate Governance Committee of the Board of Directors and the entire Board of Directors unanimously recommends a vote “FOR” the election of Messrs. Rick L. Wessel and James H. Graves as directors of the Company.
CORPORATE GOVERNANCE, BOARD MATTERS AND DIRECTOR COMPENSATION
Board of Directors, Committees and Meetings
The Board of Directors held fourfive meetings during the year ended December 31, 2017. All of the directors each2020. Each director attended, either telephonically or in person, at least 75% of the meetings of the Board of Directors during their respective terms, with the exception of Amb. Montaño who did not attend two of the meetings.terms. Members of the Board of Directors are encouraged to attend the Company’s Annual Meeting; however, attendance is not mandatory. Messrs. Wessel Feehan and BerceFeehan attended last year’s Annual Meeting. In addition, the independent directors of the Company meet separately in executive sessions after regularly scheduled meetings of the Board of Directors and more frequently as deemed appropriate by the independent directors.
During 2017,2020, all of the independent directors (Messrs. Berce, Faulkner, Graves and Owen) served as members of today, the committees are composedAudit, Compensation and Nominating and Governance Committees. The chairperson for each committee during 2020 was as follows:
•Audit Committee - Mr. Berce
•Compensation Committee - Mr. Owen for the period from January 1, 2020 to July 20, 2020 and Mr. Graves for the period from July 21, 2020 to December 31, 2020 |
| | | | | | |
| Independent Director | | Audit | | Compensation | | Nominating and Corporate Governance |
| Mikel D. Faulkner (Lead Independent Director) | | | | l | | Chair |
| Daniel E. Berce | | Chair | | | | l |
| James H. Graves | | l | | l | | |
| Jorge Montaño | | | | | | l |
| Randel G. Owen | | l | | Chair | | |
| | | | | | | |
| Meetings Held in 2017 | | 6 | | 4 | | 1 |
All of theDuring 2020, each committee members eachmember attended, either telephonically or in person, at least 75% of the meetings of their respective committees. During 2020, the Audit Committee held four meetings, of the committees during their respective terms.Compensation Committee held five meetings and the Nominating and Corporate Governance Committee held four meetings.
Mr. Feehan currently serves as non-executive Chairman ofFollowing Ms. Paula K. Garrett’s appointment to the Board of Directors ofon January 1, 2021, the Companycommittees were reconstituted as provided under the terms of the employment agreement he entered into with Cash America prior to the Merger. For a description of Mr. Feehan’s current employment agreement, see Cash America’s proxy statement on Schedule 14A filed with the SEC on April 7, 2016. Mr. Feehan’s employment agreement is filed as Exhibit 10.1 to Cash America’s Current Report on Form 8-K filed with the SEC on April 6, 2015.follows:
| | | | | | | | | | | | | | | | | | | | |
| Independent Director | | Audit | | Compensation | | Nominating
and
Corporate
Governance |
| Mikel D. Faulkner (Lead Independent Director) | | | | l | | l |
| Daniel E. Berce | | Chair | | l | | |
| Paula K. Garrett | | l | | | | |
| James H. Graves | | | | Chair | | l |
| Randel G. Owen | | l | | | | Chair |
Board Committees
Audit Committee. The Audit Committee is responsible for the oversight of the Company’s accounting and financial reporting processes. This includes the selection and engagement of the Company’s independent registered public accounting firm and review of the scope of the annual audit, audit fees and results of the audit. The Audit Committee reviews and discusses with management and the Board of Directors such matters as accounting policies, internal accounting controls, procedures for preparation of financial statements and other financial disclosures, scope of the audit, the audit plan and the independence of such accountants. In addition, the Audit Committee has oversight over the Company’s internal audit function.and regulatory compliance functions. The Board of Directors has determined that Messrs. Berce, Graves and Owen areall members of the Audit Committee qualify as an audit committee financial expertsexpert as defined by Item 401(h) of Regulation S-K promulgated under the Securities Act of 1933, as amended (“Securities Act”), and the Securities Exchange Act of 1934, as amended (“Exchange Act”). The Board of Directors has adopted a charter for the Audit Committee which is available to stockholders as described below.
Compensation Committee. The Compensation Committee is responsible for reviewing and approving corporate goals and objectives relevant to the compensation of the Company’s CEO, evaluating the CEO’s performance in light of those goals and objectives, and recommending to the Board of Directors for approval of the CEO’s compensation. The Compensation Committee is also responsible for recommending to the Board of Directors for approval the compensation of all other executive officers of the Company. In addition, the Compensation Committee oversees and approves grants and awards under the Company’s equity-based plans, incentive compensation plans and tax-qualified employee benefit plans, and approves severance and other termination payments to executive officers.
The Board of Directors has adopted a charter for the Compensation Committee which is available to stockholders as described below. Pursuant to its charter, the Compensation Committee may delegate all or a portion of its duties and responsibilities to one or more subcommittees consisting of one or more of its members. For more information regarding the Compensation Committee’s process and procedures for consideration of executive compensation, see “Compensation Discussion and Analysis.”
Nominating and Corporate Governance Committee. The Nominating and Corporate Governance Committee is responsible for making recommendations to the Board of Directors concerning the governance structure and practices of the Company, including the size of the Board of Directors and the size and composition of various committees of the Board of Directors. In addition, the Nominating and Corporate Governance Committee is responsible for identifying individuals believed to be qualified to become directors, and to recommend to the Board of Directors the nominees to stand for election as directors at the Annual Meeting of Stockholders. The Board of Directors has adopted a charter for the Nominating and Corporate Governance Committee, which was revised in April 2020. The charter is available to stockholders as described below.
The Board of Directors has determined that each member of the Audit Committee, the Compensation Committee and the Nominating and Corporate Governance Committee is independent under the listing standards of the NYSE,Nasdaq, the SEC rules and the Company’s Corporate Governance Guidelines. Each of the Company’s committee charters is publicly available and can be accessed on the Investor Relations page of the Company’s website at ir.firstcash.com.investors.firstcash.com. Copies of the Company’s committee charters are also available, free of charge, by submitting a written request to the Corporate Secretary, at 1600 West 7th Street, Fort Worth, Texas 76102.
Directors’ Compensation
2017 Director Compensation
Prior to 2017, the compensation paid to directors of the Company was in the form of a cash retainer of $150,000 per year. In connection with the completion of the Merger, theThe Board of Directors engaged an independent consulting firm, Pay Governance, to benchmarkreviews director compensation on a periodic basis. Such reviews include collecting and analyzing benchmarking information from compensation advisory firms regarding the compensationamount and structure of the independent directors against the compensation of directors in the Company’s 2017 peer group as discussed in the “Compensation Discussion and Analysis.” Pay Governance reviewed the structure of director compensation as it relatescompared to total compensation and the mix or elements of compensation. Based on the input from Pay Governance and review of other benchmarking information, theits peers. The Board of Directors determined the compensation for independent directors beginning in 2017for 2020 would be structured as follows:
•Annual cash compensation of $90,000,$100,000, paid in quarterly installments of $22,500$25,000
Annual grants•A grant of 1,343 restricted stock units, valued at $90,000 vesting monthly through$114,061 on the first anniversarydate of the grant, dateJanuary 28, 2020, which fully vested on December 31, 2020
•Supplemental annual cash payments of $20,000$25,000 to the lead independent director, $25,000 to the Audit Committee chairman, $15,000$20,000 to the Compensation Committee chairman and $10,000$15,000 to the Nominating and Corporate Governance Committee chairman. All amounts are paid in quarterly installments.
The Board of Directors believes the mix of cash and equity compensation provides a balance between short-term cash compensation and long-term compensation tied to the Company’s stock price performance and serves to match the interests of the Company’s independent directors with those of stockholders. Based upon benchmark data provided by Pay Governance,of the Company’s 2020 Peer Group (as discussed in the “Compensation Discussions and Analysis”), the Board also believes the total director compensation and the mix of compensation is within the competitive range of such compensation for the companies in the peer group.2020 Peer Group.
For the year ended December 31, 2017,2020, the independent directors received compensation for service as a director as described above. There are no supplemental payments for attending the meetings of the Board of Directors and committee meetings. In addition, the directors were reimbursed for their reasonable expenses incurred for each Board of Directors and committee meetings attended. The Company only compensates independent non-employee directors for their services as directors. The compensation paid to Mr. Feehan is described below and the compensation paid to Mr. Wessel is described in the “Compensation Discussion and Analysis” section of this Proxy Statement.
The following table presents information regarding the compensation paid to the non-employee members of the Company’s Board of Directors,independent directors and to Mr. Feehan for the year ended December 31, 2017:2020:
| | | | | | | | | | | | | | | | | | | | | | | | | | |
| Name | | Fees Earned or
Paid in Cash
$ | | Stock Awards
$ | | All Other Compensation
$ | | Total
$ |
| Daniel E. Berce | | 125,000 | | | 114,061 | | | — | | | 239,061 | |
| Mikel D. Faulkner | | 125,000 | | | 114,061 | | | — | | | 239,061 | |
| | | | | | | | |
| James H. Graves | | 117,500 | | | 114,061 | | | — | | | 231,561 | |
| Randel G. Owen | | 117,500 | | | 114,061 | | | — | | | 231,561 | |
Daniel R. Feehan (1) | | — | | | — | | | 300,000 | | | 300,000 | |
(1) Mr. Feehan currently serves as the chairman of the Board of Directors of the Company. Mr. Feehan also served in 2020 as a non-executive employee of the Company pursuant to an employment agreement dated January 28, 2020, which is filed as Exhibit 10.16 to the Company’s Annual Report on Form 10-K filed with the SEC on February 3, 2020. For a description of Mr. Feehan’s current employment agreement, see “Feehan Employment Agreement” below. The compensation reported represents his salary during the year ended December 31, 2020. In addition, the Company paid for certain standard employee benefit programs for Mr. Feehan, including participation in group health, welfare and retirement benefit plans, which are generally available to all employees.
|
| | | | | | | | | | | | |
| Name | | Fees Earned or Paid in Cash $ | | Stock Awards $ (2) | | All Other Compensation $ | | Total $ |
| Daniel E. Berce | | 110,000 |
| | 90,000 |
| | — |
| | 200,000 |
|
| Mikel D. Faulkner | | 100,000 |
| | 90,000 |
| | — |
| | 190,000 |
|
Daniel R. Feehan (1) | | — |
| | — |
| | 250,000 |
| | 250,000 |
|
| James H. Graves | | 90,000 |
| | 90,000 |
| | — |
| | 180,000 |
|
| Jorge Montaño | | 90,000 |
| | 90,000 |
| | — |
| | 180,000 |
|
| Randel G. Owen | | 105,000 |
| | 90,000 |
| | — |
| | 195,000 |
|
| |
(1)
| Mr. Feehan serves as the Chairman of the Board of Directors of the Company. Mr. Feehan also served as a non-executive employee of Cash America pursuant to an Employment Agreement dated April 3, 2015 (the “Feehan Employment Agreement”). In connection with the Merger, the Company assumed the Feehan Employment Agreement, and Mr. Feehan currently serves as a non-executive employee of the Company pursuant to the terms of the Feehan Employment Agreement. For a description of the Feehan Employment Agreement, see Cash America’s proxy statement on Schedule 14A filed with the SEC on April 7, 2016. The Feehan Employment Agreement is filed as Exhibit 10.1 to Cash America’s Current Report on Form 8-K filed with the SEC on April 6, 2015. The compensation reported represents his salary during the year ended December 31, 2017. In addition, the Company paid for certain standard employee benefit programs for Mr. Feehan, including participation in group health, welfare and retirement benefit plans, which are generally available to all employees. |
Feehan Employment Agreement
| |
(2)In January of 2020, the Company’s chairman of the Board of Directors, Mr. Feehan, entered into a new employment agreement with the Company. The agreement, which was effective January 1, 2020 and ends on December 31, 2023, provides Mr. Feehan an annual salary of $300,000 and the right to participate in all of the Company’s savings, retirement and welfare benefit plans available to other employees of the Company. Mr. Feehan is not entitled to bonuses, equity grants or other director compensation under this agreement.
The agreement provides that if Mr. Feehan’s employment with the Company is terminated during the term by the Company without “cause” or by the executive for “good reason” (as such terms are defined in the employment agreement), Mr. Feehan would be entitled to a lump sum cash severance payment equal to one times (or two times, if such termination occurs within twelve months following a change in control of the Company) his salary in effect as of the termination. He would also be entitled to continue to participate in the Company’s health and welfare benefit plans at active employee rates for a period of eighteen months (the “COBRA subsidy”). Furthermore, if such termination occurs within twelve months following a change in control of the Company, the Company will pay to the executive, in lieu of the COBRA subsidy described above, a lump sum in cash in an amount equal to the full monthly cost of health and welfare benefit coverage multiplied by 24.
The agreement prohibits Mr. Feehan from competing with the Company during the employment term and for a period of 24 months following termination of employment. Mr. Feehan is also prohibited from soliciting customers of the Company and from recruiting Company employees during this period.
| During 2017, each independent director was granted 2,067 restricted stock units. The $90,000 amount for each director represents the aggregate fair value of the restricted stock units based on a price of $43.55 per share on the date of grant. As of December 31, 2017, each of the non-employee members of the Company’s Board of Directors held 2,067 unvested restricted stock units. |
Code of Business Conduct and Ethics
During 2016, the Company adopted a newThe Code of Ethics that applies to all of its directors, officers,Business Conduct and key employees. The Company intends to disclose future amendments to, or waivers from, provisions of its Code of Ethics on its website in accordance with applicable NYSE and the SEC requirements. The Code of Ethics is publicly available and can be accessed on the Company’s website at www.firstcash.com.www.firstcash.com. The Company intends to disclose future amendments to, or waivers from, certain provisions of its Code of Business Conduct and Ethics on its website in accordance with applicable Nasdaq and SEC requirements. Copies of the Company’s Code of Business Conduct and Ethics are also available, free of charge, by submitting a written request to the Corporate Secretary, atFirstCash, Inc., Investor Relations, 1600 West 7th Street, Fort Worth, Texas 76102.
Stock Ownership Guidelines for Directors
In an effort to further align the interests of the directors with the interests of stockholders, the Company adopted a stock ownership guideline for non-employee directors in 2016 which became effective beginning in 2017. The guidelines callguideline calls for stock ownership (including the value of non-vested RSU’s)restricted stock units “RSU’s”) having a value equal to five times each director’s annual cash retainer with a five-year graceaccumulation period beginning in 2017 to fully comply with the guideline once a director becomes subject to the guideline. As of December 31, 2017, two of theApril 12, 2021, all five independent directors have either met the new ownership guideline or have additional time to meet the guideline. Directors who have not met the guideline must retain their vested stock awards until they meet the guideline. While the guidelines do not apply to employee directors, the current stock ownership of the two employee directors would meet the guidelines if calculated at five times their annual salary as an employee of the Company.
Director Election (Majority Voting) Policy
The Company has adopted a Director Election (Majority Voting) Policy. Pursuant to this policy, in an uncontested election of directors (that is, an election where the number of nominees is equal to the number of seats open) any nominee for director who receives a greater number of “WITHHOLD” votes than “FOR” votes for his election must promptly submit an offer of resignation to the Nominating and Corporate Governance Committee following the certification of the stockholder vote for consideration in accordance with the following procedures.
The Nominating and Corporate Governance Committee will consider any tendered resignation and, promptly following the date of the stockholders’ meeting at which the election occurred, will make a recommendation to the Board of Directors concerning the acceptance or rejection of such resignation. In determining its recommendation to the Board of Directors, the Nominating and Corporate Governance Committee will consider all factors deemed relevant by the members of the Nominating and Corporate Governance Committee including, without limitation, the stated reason or reasons why stockholders who cast “withhold” votes for the director did so, the qualifications of the director (including, for example, the impact the director’s resignation would have on the Company’s compliance with the requirements of the SEC and the rules of the NYSE)Nasdaq), and whether the director’s resignation from the Board of Directors would be in the best interests of the Company and its stockholders.
The Nominating and Corporate Governance Committee also will consider a range of possible alternatives concerning the director’s tendered resignation as members of the committee deem appropriate, including, without limitation, acceptance of the resignation, rejection of the resignation, or rejection of the resignation coupled with a commitment to seek to address and cure the underlying reasons reasonably believed by the Nominating and Corporate Governance Committee to have substantially resulted in the “withheld” votes.
The Board of Directors will publicly disclose its decision regarding whether to accept or reject such resignation within 90 days following certification of the shareholderstockholder vote and shall disclose the reasons therefore. The Director Election (Majority Voting) Policy is publicly available and can be accessed on the Investor Relations page of the Company’s website at ir.firstcash.cominvestors.firstcash.com.
Director Independence
The Board of Directors has determined that, with the exception of Mr.Messrs. Wessel and Mr. Feehan, all of its directors, including all of the members of the Audit, Compensation, and Nominating and Corporate Governance Committees, are “independent” as defined by the NYSE,Nasdaq, the SEC and the Company’s Corporate Governance Guidelines. No director is deemed independent unless the Board of Directors affirmatively determines the director has no material relationship with the Company. In making its determination, the Board of Directors observes all criteria for independence established by the rules of the SEC and the NYSE.Nasdaq.
Oversight of Risk Management
The Board of Directors is responsible for overseeing and monitoring the material risks facing the Company. In its oversight role, the Board of Directors regularly reviews the Company’s strategic initiatives, which address, among other things, the risks and opportunities facing the Company. The Board of Directors also has overall responsibility for executive officer succession planning and reviews succession plans from time to time. The Board of Directors has delegated certain risk management oversight responsibility to its committees. As part of its responsibilities set forth in its charter, the Audit Committee is responsible for discussing with management the Company’s major risk exposures, including financial risks and cybersecurity, and the steps management has taken to monitor and control those exposures, including the Company’s risk assessment and risk management policies.
The Compensation Committee reviews the risks and rewards associated with the Company’s compensation programs. With the assistance of an independent compensation consulting firm, the Compensation Committee designs compensation programs with features that mitigate risk without diminishing the incentive nature of the compensation. While these performance-based compensation and equity programs have been designed and administered in a manner that discourages undue risk-taking by employees, the Compensation Committee believes these programs create appropriate incentives to increase long-term stockholder value. The Compensation Committee has discussed the concept of risk as it relates to the compensation programs and the Compensation Committee does not believe the compensation programs encourage excessive or inappropriate risk taking for the following reasons:
•The Company structures its pay to consist of both fixed and variable compensation. The fixed portion of compensation (salary) is designed to provide a steady income independent of the Company’s stock price performance so that executives do not feel pressured to focus exclusively on short-term stock price performance to the long-term detriment of other important business decisions and metrics and are not encouraged to take unnecessary or excessive risks to achieve corporate objectives. The variable portions of compensation (incentive-based cash and equity awards) are designed to reward both short- and long-term corporate performance. For short-term performance, the Company utilizes annual incentive-based cash awards that are based primarily on achieving a combination of revenue and earnings metrics and strategic directives.metrics. The metrics and directives are set annually by the Compensation Committee and approved by the Board of Directors. For long-term performance, the Company grants restricted stock awards with a multi-year vesting period tied to the achievement of long-term earnings metrics and store growth targets. Beginning in 2020, the Company added a three-year cumulative relative total shareholder return (“TSR”) metric to its long-term incentive plan and, beginning in 2021, added a one-year relative TSR metric to its annual incentive plan. The Company believes these variable elements of compensation are a sufficient percentage of overall compensation to motivate executives to produce both superior short- and long-term corporate results.
•Because earnings targets, such as adjusted EBITDA, adjusted net income and adjusted diluted earnings per share, are the primarysignificant performance elements used for determining incentive payments, the Company believes its executives are encouraged to take a balanced approach that focuses on corporate profitability, rather than other measures which may incite management to drive sales or growth targets without regard to cost or profitability.
•The Company caps cash payments for the goals under its annual incentive plan and caps the number of restricted stock units granted under its long-term incentive plan, which the Company believes also mitigates excessive risk taking. Even if the Company dramatically exceeds its targets, annual incentive payouts and stock grants are limited by such caps. Conversely, the Company has a floor on earnings and growth targets so that performance below a certain level (as approved by the Compensation Committee) does not result in annual incentive payouts or vesting of stock grants.
•The Company’s incentive compensation programs have been structured primarily around the attainment ofutilized meaningful earnings and growth targets for many years and the Company has seen no evidence that this encourages unnecessary or excessive risk taking.
•The Company believes the use of distinct long-term incentive plans, primarily restricted stock unit awards, with performance-based vesting over a number ofthree years, provides a strong incentive for sustained operational and financial performance and aligns the interests of the Company’s named executive officers with those of its stockholders. The addition of relative TSR performance metrics provides even further alignment with shareholders.
•The Compensation Committee has discretion to adjust payouts under both the annual and long-term performance plans to reflect the core operating performance of the business, but prohibits discretion for payouts above stated maximum awards.
Board Leadership Structure
Mr. Feehan serves as chairman of the board,Board of Directors, while Mr. Wessel serves in the role of CEO and is also the vice-chairman of the board. During 2017, the Board of Directors established the position of Lead Independent Director and elected Mr. Faulkner to serve in this role. As the Lead Independent Director,Directors. In addition, Mr. Faulkner serves as the lead independent director, serving as a liaison between the independent directors and management, chairschairing executive sessions of the non-management and independent directors and consultsconsulting with the chairman and CEO on board agendas and meeting materials.
The Board of Directors recognizes the leadership structure and combination or separation of the chairman, lead independent director and CEO roles is driven by the needs of the Company at any point in time. The Board of Directors does not believe there should be a fixed rule as to whether the offices of chairman and CEO should be vested in the same person or two different people, or whether the chairman should be an employee of the Company or should be elected from among the non-employee directors. The needs of the Company and the individuals available to fulfill these roles may dictate different outcomes at different times, and the Board of Directors believes that retaining flexibility in these decisions is in the best interest of the Company and its stockholders.
Director Qualifications
At a minimum, candidates for election or appointment to the Board of Directors must have integrity, be committed to act in the best interest of all the Company’s stockholders and be able and willing to devote the required amount of time to the Company’s affairs, including attendance at meetings of the Board of Directors. In recommending candidates, the Nominating and Corporate Governance Committee takes into consideration any criteria approved by the Board and such other factors as it deems appropriate, including, among other things, the candidate’s judgment, skill, diversity, and experience with business and other organizations of comparable size. The Nominating and Corporate Governance Committee endeavors to evaluate, propose and approve candidates, including those recommended by stockholders, with business experience and personal skills in finance, marketing, financial reporting and other areas that may be expected to contribute to an effective Board of Directors. The Nominating and Corporate Governance Committee seeks to assure that the Board of Directors is composed of individuals who have experience relevant to the needs of the Company and who have the highest professional and personal ethics, consistent with the Company’s values and standards. Candidates should be committed to enhancing stockholder value and should have sufficient time to carry out their duties and to provide insight and practical wisdom based on experience. Each director must represent the interests of all stockholders.
In recommending candidates, the Nominating and Corporate Governance Committee takes into consideration any criteria approved by the Board of Directors and such other factors as it deems appropriate, including:
•The extent of the candidate’s educational, business, non-profit or professional acumen and experience;
•Whether the candidate assists in achieving a mix of board members that represents a diversity of background, perspective and experience, including with respect to age, gender, race, place of residence and specialized experience;
•Whether the candidate meets the independence requirements established by Nasdaq, the SEC and the Company’s Corporate Governance Guidelines;
•Whether the candidate has the financial acumen or other professional, educational or business experience relevant to an understanding of the Company’s business;
•Whether the candidate would be considered a “financial expert” or “financially sophisticated” as defined by Nasdaq or applicable law;
•Whether the candidate, by virtue of particular technical expertise, experience or specialized skill relevant to the Company’s current or future business, will add specific value as a board member; and
•Whether the candidate possesses a willingness to challenge and stimulate management and the ability to work as part of a team in an environment of trust.
The Nominating and Corporate Governance Committee does not assign specific weights to particular criteria and no particular criterion is necessarily applicable to all prospective nominees. In addition to the criteria set forth above, the Nominating and Corporate Governance Committee considers how the skills and attributes of each individual candidate or incumbent director work together to create a board that is collegial, engaged and effective in performing its duties.
Although there is no specific policy on considering diversity, the Board of Directors and the Nominating and Corporate Governance Committee take various diversity-related considerations into account in the selection criteria for new directors. The Nominating and Corporate Governance Committee seeks members from diverse professional and personal backgrounds to combine a broad spectrum of experience and expertise with a reputation for integrity. The Board considers gender, race, nationality, language skills and other personal characteristics in this process and the extent to which the prospective nominee helps the Board of Directors reflect the gender, racial, ethnic and global diversity of the Company’s stockholders, employees and customers.
In this regard, the Board of Directors and the Nominating and Corporate Governance Committee are committed to including highly qualified women and individuals from minority groups in the pool of new candidates for membership. During 2020, the Nominating and Corporate Governance worked to identify female candidates to serve on the Board of Directors. As a result of these efforts, the Nominating and Corporate Governance Committee identified a highly qualified female candidate, Ms. Paula Garrett, for consideration as a director. Based on the recommendation of the Nominating and Corporate Governance Committee and the unanimous approval of the full Board of Directors, Ms. Garrett was added to the Board of Directors effective January 1, 2021. The Company’s Board of Directors continues to recognize that it could benefit from adding an additional highly qualified female and/or minority candidate.
The Company’s Board of Directors is currently composed of well qualified directors, and each director has the requisite experience, skills and characteristics to serve on the Board.board. Among, or in addition to, the backgrounds and experiences described in “Proposal 1 - Election of Directors” of this Proxy Statement:
•Mr. Feehan, the Company’s chairman, brings over 3035 years of experience as a director, chief executive officer and chief financial officer with Cash America and a deep understanding of the pawn industry and the legacy Cash America business.
•Mr. Wessel, the Company’s vice-chairman and chief executive officer, brings over 25 years of management and executive experience in the pawn industry gained from his roles as chief financial officer, chief executive officer and director of the Company. His deep understanding of the Company’s business and his success in expanding its business has been invaluable to the Board.Board of Directors.
•Mr. Berce brings broad senior executive leadership with significant experience in the consumer finance industry, and functional expertise in corporate finance and accounting, together with service on other public company boards of directors, including Cash America.
•Mr. Faulkner brings broad senior executive leadership and financial experience, including with domestic and multi-national public and private companies in various industries. Mr. Faulkner’s qualifications include direct executive experience in certain Latin American markets where the Company currently operates or intends to operateAmerica.
•Ms. Garrett brings broad senior executive leadership experience along with exceptional functional business experience in the future.Latin America.
•Mr. Graves brings significant experience in corporate strategy and finance gained from his experience as the managing partner of a management consulting firm and a financial strategy executive, together with meaningful service on the boards of other public companies, including Cash America.
Mr. Montaño brings extensive international experience in Mexico and Latin America gained during his time as a diplomat and a business consultant. His guidance has been invaluable as the Company continues to expand in Latin America.
•Mr. Owen brings broad senior executive leadership and financial experience with private and public companies, and functional expertise in corporate finance and accounting.
Although there is no specific policy on considering diversity, the Board of Directors and the Nominating and Corporate Governance Committee take various diversity-related considerations into account in the selection criteria for new directors. The Nominating and Corporate Governance Committee seeks members from diverse professional backgrounds to combine a broad spectrum of experience and expertise with a reputation for integrity. Some additional considerations may include national origin, gender, race, functional background and the diversity of perspectives that the candidate would bring to the Board of Directors.
Identifying and Evaluating Nominees for Directors
The Nominating and Corporate Governance Committee will utilize a variety of methods for identifying and evaluating nominees for director. Candidates may come to the attention of the Nominating and Corporate Governance Committee through current members of the Board of Directors, professional search firms, stockholders or other persons. These candidates will be evaluated at regular or special meetings of the Nominating and Corporate Governance Committee, and may be considered at any point during the year. The Nominating and Corporate Governance Committee will also consider properly submitted stockholder nominations for candidates for the Board of Directors. The procedures to be followed by stockholders in submitting such nominations are set forth in the “Stockholder Proposals” section. Following verification of the stockholder status of persons proposing candidates, recommendations will be aggregated and considered by the Nominating and Corporate Governance Committee. If any materials are provided by a stockholder in connection with the nomination of a director candidate, such materials will be forwarded to the Nominating and Corporate Governance Committee. The Nominating and Corporate Governance Committee may also review materials provided by professional search firms or other parties in connection with a nominee who is not proposed by a stockholder.
Procedure for Stockholders and Interested Parties Communications with Directors
The Board of Directors has established a procedure for stockholders and other interested parties to send communications to the Board of Directors. Stockholders and other interested parties may communicate with the Board of Directors generally or with a specific director or the independent directors at any time by writing to the Company’s Corporate Secretarycorporate secretary at the Company’s address, 1600 West 7th Street, Fort Worth, Texas 76102. The Corporate Secretarycorporate secretary will review all messages received and will forward any message that reasonably appears to be a communication that deals with the functions of the Board of Directors or the standing committees of the Board of Directors, or that otherwise requires the attention of the Board of Directors and the Nominating and Corporate Governance Committee. Communications will be sent as soon as practicable to the director, or group of directors, including the independent directors, to whom they are addressed, or if addressed to the Board of Directors generally, to the chairman of the Nominating and Corporate Governance Committee. Because other appropriate avenues of communication exist for matters that are unrelated to the duties and responsibilities of the Board of Directors, such as general business complaints or employee grievances, communications of such matters will not be forwarded to the Board of Directors. The Corporate Secretarycorporate secretary has the option, but not the obligation, to forward these other communications to appropriate channels within the Company.
Corporate Governance Guidelines
The Company’s Corporate Governance Guidelines, originally adopted in 2016 and most recently revised in October 2017,April 2020, meet or exceed the listing standards adopted by the New York Stock ExchangeNasdaq and are posted on the Investor Relations page of the Company’s website, ir.firstcash.com,investors.firstcash.com, and are also available in print upon request to the Company’s Corporate Secretary.corporate secretary.
SECURITY OWNERSHIP OF CERTAIN BENEFICIAL OWNERS AND MANAGEMENT AND RELATED STOCKHOLDER MATTERS
Beneficial Ownership of Management and Directors
The following tables set forth, as of April 13, 2018,12, 2021, the number and percentage of outstanding shares of Common Stock owned by: (a)(i) each of the Company’s directors or director nominees; (b)(ii) the named executive officers as defined in Item 402 of Regulation S-K; and (c)(iii) all directors and executive officers, as a group.
Beneficial ownership has been determined in accordance with Rule 13d-3 under the Exchange Act. Under this rule, certain shares may be deemed to be beneficially owned by more than one person (if, for example, persons share the power to vote or the power to dispose of the shares). In addition, shares are deemed to be beneficially owned by a person if the person has the right to acquire shares (for example, upon exercise of an option or warrant) within 60 days of the date as of which the information is provided. In computing the percentage ownership of any person, the amount of shares is deemed to include the amount of shares beneficially owned by such person by reason of such acquisition rights. As a result, the percentage of outstanding shares of any person as shown in the following table does not necessarily reflect the person’s actual voting power at any particular date.
To the best of the Company’s knowledge, the persons named in the table have sole voting and investment power with respect to all shares of Common Stock shown as beneficially owned by them.
| | | | | | | | | | | | | | | | | | | | | | | | | | |
| Beneficial Owner | | Number of Shares
Common Stock | | Number of Shares Underlying Exercisable Options or RSUs Vesting Within 60 Days | | Total Number of Shares Beneficially Owned | | Percent (1) |
| Directors: | | | | | | | | |
| Daniel E. Berce | | 18,415 | | | 692 | | (2) | 19,107 | | | * |
| Mikel D. Faulkner | | 7,620 | | | 692 | | (2) | 8,312 | | | * |
| Daniel R. Feehan | | 53,269 | | | — | | | 53,269 | | | * |
| Paula K. Garrett | | — | | | 692 | | (2) | 692 | | | * |
| James H. Graves | | 22,615 | | | 692 | | (2) | 23,307 | | | * |
| Randel G. Owen | | 5,920 | | | 692 | | (2) | 6,612 | | | * |
| | | | | | | | |
| Executive officers: | | | | | | | | |
| Rick L. Wessel (also a Director) | | 801,100 | | | — | | | 801,100 | | | 1.95 | % |
| T. Brent Stuart | | 42,620 | | | — | | | 42,620 | | | * |
| R. Douglas Orr | | 153,228 | | (3) | — | | | 153,228 | | | * |
| Raul R. Ramos | | 7,740 | | | — | | | 7,740 | | | * |
| Anna M. Alvarado | | 6,822 | | | — | | | 6,822 | | | * |
| | | | | | | | |
| Executive officers and directors as a group | | | | | | | | |
| (11 persons, including the nominees for director) | | 1,119,349 | | | 3,460 | | | 1,122,809 | | | 2.74 | % |
(1) Based on 41,027,426 shares of Common Stock issued and outstanding as of April 12, 2021.
(2) Reflects a pro rata portion of unvested restricted stock units that would become vested and convert to shares of Common Stock upon termination of service as a director by reason of retirement.
(3) Includes 52,500 shares held by a family limited partnership and 38,801 shares held by a spousal trust.
* Ownership percentage is less than 1%
|
| | | | | | | | | | | | |
| Beneficial Owner | | Number of Shares Common Stock | | Number of Shares Underlying Exercisable Options or RSUs Vesting Within 60 Days | | Total Number of Shares Beneficially Owned | | Percent (1) |
| Directors: | | | | | | | | |
| Daniel E. Berce | | 14,562 |
| | 413 |
| (3) | 14,975 |
| | * |
|
| Mikel D. Faulkner | | 2,067 |
| | 413 |
| (3) | 2,480 |
| | * |
|
| Daniel R. Feehan | | 115,792 |
| (2) | — |
| | 115,792 |
| | * |
|
| James H. Graves | | 29,359 |
| | 413 |
| (3) | 29,772 |
| | * |
|
| Jorge Montaño | | 2,067 |
| | 413 |
| (3) | 2,480 |
| | * |
|
| Randel G. Owen | | 2,067 |
| | 413 |
| (3) | 2,480 |
| | * |
|
| | | | | | | | | |
| Executive officers: | | | | | | | | |
| Rick L. Wessel (also a Director) | | 939,700 |
| | — |
| | 939,700 |
| | 2.07 | % |
| R. Douglas Orr | | 155,000 |
| | — |
| | 155,000 |
| | * |
|
| Raul R. Ramos | | 15,487 |
| | — |
| | 15,487 |
| | * |
|
| T. Brent Stuart | | 8,283 |
| | — |
| | 8,283 |
| | * |
|
| Anna M. Alvarado | | 941 |
| | — |
| | 941 |
| | * |
|
| | | | | | | | | |
| Executive officers and directors as a group | | | | | | | | |
| (11 persons, including the nominees for director) | | 1,285,325 |
| | 2,065 |
| | 1,287,390 |
| | 2.83 | % |
| | | | | | | | |
| Based on 45,415,242 shares of common stock issued and outstanding as of April 13, 2018. |
| |
(2)
| Includes 47,567 shares held in an irrevocable trust of which Mr. Feehan is the sole trustee. |
| |
(3)
| Reflects a pro rata portion of unvested restricted stock units that would become vested and convert to shares of common stock upon termination of service as a director by reason of retirement. |
| |
* | Ownership percentage is less than 0.5% |
Beneficial Owners Who Hold More than 5% of the Company’s Common Stock
The table below shows information for persons known by the Company to beneficially own more than 5% of the Company’s Common Stock based on their filings with the SEC through April 13, 2018:12, 2021:
| | | | | | | | | | | | | | | | | | | | |
| | | Shares Beneficially Owned |
| Name and Address of Beneficial Owner | | Number | | Percent (1) |
| BlackRock, Inc. | | 4,821,724 | | (2) | | 11.75 | % |
| 55 East 52nd Street
New York, NY 10055 | | | | | |
| FMR LLC | | 4,512,514 | | (3) | | 11.00 | % |
| 245 Summer Street
Boston, MA 02210 | | | | | |
| The Vanguard Group | | 3,622,898 | | (4) | | 8.83 | % |
| 100 Vanguard Boulevard
Malvern, PA 19355 | | | | | |
| EARNEST Partners, LLC | | 2,519,301 | | (5) | | 6.14 | % |
| 1180 Peachtree Street NE, Suite 2300
Atlanta, GA 30309 | | | | | |
| William Blair Investment Management, LLC | | 2,343,115 | | (6) | | 5.71 | % |
| 150 North Riverside Plaza
Chicago, IL 60606 | | | | | |
|
| | | | | | | | |
| | | | Shares Beneficially Owned |
| Name and Address of Beneficial Owner | | Number | | Percent (1) |
| BlackRock, Inc. | | 5,912,375 |
| (2) | | 13.02 | % |
| | 55 East 52nd Street New York, NY 10055 | | | | | |
| The Vanguard Group | | 4,251,298 |
| (3) | | 9.36 | % |
| | 100 Vanguard Boulevard Malvern, PA 19355 | | | | | |
| |
(1)
| Based on 45,415,242 shares of common stock issued and outstanding as of April 13, 2018. |
| |
(2)
| (2)This information is based on a Schedule 13G/A filed with the SEC on January 19, 2018. BlackRock, Inc. reports that it has sole voting power over 5,802,194 shares of Common Stock and sole dispositive power over 5,912,375 shares of Common Stock beneficially owned. |
| |
(3)
| This information is based on a Schedule 13G/A filed with the SEC on February 9, 2018. The Vanguard Group reports that it has sole dispositive power of 4,188,580 shares of Common Stock, shared dispositive power over 62,718 shares of Common Stock, sole voting power over 58,213 shares of Common Stock and shared voting power over 8,278 shares of Common Stock beneficially owned. |
SECTION 16(a) BENEFICIAL OWNERSHIP REPORTING COMPLIANCE
Based solely on the reports furnished pursuant to Section 16a-3(e) of the Exchange Act and representations made to the Company, all reports as required under Section 16(a) of the Exchange Act were filed on a timely basis duringSchedule 13G/A filed with the year ending December 31, 2017.SEC on January 27, 2021. BlackRock, Inc. reports that it has sole voting power over 4,726,780 shares of Common Stock and sole dispositive power over 4,821,724 shares of Common Stock beneficially owned.
(3) This information is based on a Schedule 13G/A filed with the SEC on January 11, 2021. FMR LLC reports that it has sole voting power over 1,265,066 shares of Common Stock and sole dispositive power over 4,512,514 shares of Common Stock beneficially owned.
(4) This information is based on a Schedule 13G/A filed with the SEC on February 10, 2021. The Vanguard Group reports that it has sole dispositive power of 3,495,933 shares of Common Stock, shared dispositive power over 126,965 shares of Common Stock and shared voting power over 94,435 shares of Common Stock beneficially owned.
(5) This information is based on a Schedule 13G/A filed with the SEC on February 16, 2021. EARNEST Partners, LLC reports that it has sole voting power over 1,766,387 shares of Common Stock and sole dispositive power over 2,519,301 shares of Common Stock beneficially owned.
(5) This information is based on a Schedule 13G/A filed with the SEC on February 11, 2021. Williams Blair Investment Management, LLC reports that it has sole voting power over 2,056,143 shares of Common Stock and sole dispositive power over 2,343,115 shares of Common Stock beneficially owned.
COMPENSATION COMMITTEE INTERLOCKS AND INSIDER PARTICIPATION
During 2017,2020, Messrs. Berce, Faulkner, Graves and Owen served as members of the Compensation Committee, were not and have never been employed by the Company, and did not have any interlocking relationship with another entity requiring disclosure pursuant to SEC rules.
CERTAIN RELATIONSHIPS AND RELATED PERSON TRANSACTIONS
The Company’s Board of Directors has adopted a policy for the review of transactions in which the Company was a participant, and in which any related party of the Company (such as a namedan executive officer, director, nominee for election as a director or greater than 5% beneficial owner of Company stock, or their immediate family members), had a direct or indirect material interest. Pursuant to the Audit Committee Charter, the Audit Committee reviews proposed related party transactions and makes recommendations to the Board of Directors regarding approval or rejection of related party transactions. The Board of Directors reviews the recommendation of the Audit Committee and then approves all related party transactions prior to the Company entering into the transaction. Any such related party transaction is evaluated to determine whether such transaction is for the benefit of the Company and upon terms no less favorable to the Company than if the related party transaction was with an unrelated party. The Company had no transactions, nor are there any currently proposed transactions, in which the Company was or is to be a participant where any related party of the Company (such as a namedan executive officer, director, nominee for election as a director or greater than 5% beneficial owner of Company stock, or
their immediate family members) had a material direct or indirect interest reportable under applicable SEC rules or that required approval of the Board of Directors under the Company’s related party transaction policy.
AUDIT COMMITTEE REPORT
The Audit Committee operates under a written charter adopted by the Board of Directors. All members of the Audit Committee meet the independence standards and other criteria established by NYSE.
Nasdaq.
The Audit Committee assists the Board of Directors in fulfilling its responsibility to oversee management’s implementation of the Company’s financial reporting process. Management is responsible for the audited financial statements of the Company and for maintaining effective internal control over financial reporting. In discharging its oversight role, the Audit Committee reviewed and discussed with management and RSM US LLP (“RSM”), the Company’s independent registered public accounting firm, the audited financial statements of the Company as of and for the year ended December 31, 2017.2020. The independent registered public accounting firm is responsible for expressing an opinion on the conformity of those financial statements with accounting principles generally accepted in the United States of America. The Audit Committee has also reviewed management’s report on its assessment of the effectiveness of the Company’s internal control over financial reporting as well as the independent auditor’s report on the effectiveness of the Company’s internal control over financial reporting. Management’s Report on Internal Control over Financial Reporting is included in the Company’s Annual Report on Form 10-K for the year ended December 31, 2017.2020.
The Audit Committee met privately with RSM, US LLP, and discussed issues deemed significant by the auditor, including those required to be discussed under the applicable requirements of the Public Company Accounting Oversight Board.Board and the SEC. In addition, the Audit Committee received from RSM US LLP the written disclosures and the letter required by the applicable requirements of the Public Company Accounting Oversight Board regarding RSM US LLP’sRSM’s communications with the Audit Committee concerning independence, and the Audit Committee has discussed with RSM US LLP its independence from the Company and its management. The Audit Committee also considered whether the provision of non-audit services, if any, by RSM US LLP was compatible with maintaining its independence.
Based upon the foregoing review and discussions, the Audit Committee recommended to the Board of Directors that the audited financial statements and Management’s Report on Internal Control over Financial Reporting referred to above be filed with the Company’s Annual Report on Form 10-K for the year ended December 31, 2017.2020.
By the Audit Committee:
Daniel E. Berce
James H. GravesPaula K. Garrett
Randel G. Owen
The Audit Committee report above does not constitute “soliciting material” and will not be deemed “filed” or incorporated by reference into any of the Company’s filings under the Securities Act or the Exchange Act except to the extent that the Company specifically incorporates it by reference therein.
PROPOSAL 2
RATIFICATION OF INDEPENDENT REGISTERED PUBLIC ACCOUNTING FIRM
The Audit Committee selected RSM US LLP (“RSM”) as independent accountants to audit the books, records and accounts of the Company for the year ending December 31, 2018.2021. The Board of Directors has endorsed this appointment.
RSM was first engaged in August 2016 as the Company’s principal accountant and has audited the Company’s consolidated financial statements for the yearfive most recent years ended December 31, 2016 as a result of a competitive proposal process overseen by the Audit Committee involving multiple firms. Prior to August 2016, Hein & Associates LLP (“Hein”) served as the independent accountant to the Company and audited the Company’s consolidated financial statements for the year ended December 31, 2015 and the eleven years before that. There were no disagreements between the Company and Hein.2020.
Principal Accountant Fees and Services
Aggregate fees for professional services rendered for the Company by RSM and Hein for the years ended December 31, 20172020 and 2016,December 31, 2019, respectively, were as follows:
| | | | | | | | | | | |
| 2020 | | 2019 |
| Services Provided: | | | |
| Audit fees | $ | 768,025 | | | $ | 781,666 | |
| Audit related fees | 61,900 | | | — | |
| Tax fees | — | | | — | |
| All other fees | — | | | — | |
| Total | $ | 829,925 | | | $ | 781,666 | |
|
| | | | | | | | | | | | | | | |
| | 2017 | | 2016 |
| | RSM | | Hein | | RSM | | Hein |
| Services Provided: | | | | | | | |
| Audit | $ | 835,897 |
| | $ | — |
| | $ | 856,849 |
| | $ | 40,100 |
|
| Audit related | 63,000 |
| | 49,654 |
| | 148,000 |
| | 27,015 |
|
| Tax | — |
| | — |
| | — |
| | — |
|
| All other | — |
| | — |
| | — |
| | — |
|
| Total | $ | 898,897 |
| | $ | 49,654 |
| | $ | 1,004,849 |
| | $ | 67,115 |
|
The audit fees for the years ended December 31, 20172020 and 20162019 were for the audits of the consolidated financial statements of the Company, internal control auditing and reporting as required by Section 404 of the Sarbanes Oxley Act of 2002, issuance of consents, and review of the Company’s SEC filings. The audit related fees for fiscal 20172020 relate primarily to services provided in connection with the issuance ofCompany’s 2020 senior notes while the audit related fees for fiscal 2016 relate primarily to the Merger.offering.
Audit Committee Pre-Approval Policies and Procedures
The 20172020 and 20162019 audit and audit related services provided by RSM and Hein were approved in advance by the Audit Committee.
The Audit Committee implemented pre-approval policies and procedures related to the provision of audit and non-audit services. Under these procedures, the Audit Committee pre-approves both the type of services to be provided by the Company’s independent accountants and the estimated fees related to these services. During the approval process, the Audit Committee considers the impact of the types of services and the related fees on the independence of the auditor. The services and fees must be deemed compatible with the maintenance of the auditor’s independence, including compliance with SEC rules and regulations.
Throughout the year, the Audit Committee reviews any revisions to the estimates of audit and non-audit fees initially approved.
Ratification of the Independent Registered Public Accounting Firm
Stockholder ratification of the selection of RSM as the independent registered public accounting firm is not required by the Company’s bylaws or otherwise. However, the Board of Directors is submitting the selection of RSM to the stockholders for ratification. In the event the stockholders do not ratify the appointment of RSM as the independent registered public accounting firm for the year ending December 31, 2018,2021, the adverse vote will be considered as a direction to the Audit Committee and the Board of Directors to select other auditors for the following year. However, because of the difficulty in making any substitution of auditors so long after the beginning of the fiscal year, it is contemplated that the appointment for the year ending December 31, 20182021 will be permitted to stand unless the Audit Committee and the Board of Directors finds other good reason for making a change.
Representatives of RSM are expected to be present at the meeting, with the opportunity to make a statement if desired to do so. Such representatives are also expected to be available to respond to appropriate questions.
Required Vote
The affirmative vote of the holders of a majority of the outstanding shares of Common Stock present or represented by proxy at the Annual Meeting and entitled to vote is required to ratify the Audit Committee’s selection of RSM.
Recommendation of the Board of Directors
The Board of Directors unanimously recommends a vote “FOR” the ratification of the appointment of RSM as the Company’s independent registered public accountants for the fiscal year ending December 31, 2018.2021. Unless marked to the contrary, proxies received from stockholders will be voted in favor of ratifying the appointment of RSM as the Company’s independent registered public accountants for the fiscal year ending December 31, 20182021.
EQUITY COMPENSATION PLAN INFORMATION
The following table gives information about the Company’s Common Stock that may be issued under stockholder-approvedcompensation plans as of December 31, 20172020.
| | | | | | | | | | | | | | | | | | | | | | | | | | | | | | | | | | | |
| | | | | | | | | Number of securities |
| | | | | | | | | remaining available for |
| Number of securities to be | | | | future issuance under equity |
| issued upon exercise of | | Weighted-average exercise | | compensation plans |
| outstanding options, | | price of outstanding | | (excluding securities |
| warrants and rights | | options, warrants and rights | | reflected in column A) |
| (A) | | (B) | | (C) |
| Plan Category: | | | | | | | | | | | |
| Equity compensation plans approved by security holders | | 383,000 | | (1) | | | $ | 38.00 | | (2) | | | 3,395,000 | | (3) |
| | | | | | | | | | | |
| Equity compensation plans not approved by security holders | | — | | | | | — | | | | | — | | |
| Total | | 383,000 | | | | | $ | 38.00 | | | | | 3,395,000 | | |
(1)Amount reflects the maximum number of shares issuable pursuant to the exercise or conversion of stock options and restricted stock units (assuming the performance goals with respect to performance-based restricted stock units are achieved at maximum levels).
(2)Includes the exercise price of outstanding options only as outstanding restricted stock unit awards do not have an exercise price. |
| | | | | | | | | | | | | | | |
| | | | | | | | | | Number of securities |
| | | | | | | | | | remaining available for |
| | Number of securities to be | | | | future issuance under equity |
| | issued upon exercise of | | Weighted average exercise | | compensation plans |
| | outstanding options, | | price of outstanding | | (excluding securities |
| | warrants and rights | | options, warrants and rights | | reflected in column A) |
| | (A) | | (B) | | (C) |
| Plan Category: | | | | | | | | | | | |
| Equity compensation plans approved by security holders | | 247,000 |
| (1) | | | $ | 39.11 |
| (2) | | | 2,893,000 |
| (3) |
| | | | | | | | | | | | |
| Equity compensation plans not approved by security holders | | — |
| | | | — |
| | | | — |
| |
| Total | | 247,000 |
| | | | $ | 39.11 |
| | | | 2,893,000 |
| |
| |
(1)(3) Reflects shares available for issuance pursuant to the Company’s 2019 Long-Term Incentive Plan, all of which may be issued pursuant to grants of full-value stock awards.
| Amount reflects the maximum number of shares issuable pursuant to the exercise or conversion of stock options and restricted stock units (assuming the performance goals with respect to performance-based restricted stock units are achieved at maximum levels). |
| |
(2)
| Includes the weighted average exercise price of outstanding options only as outstanding restricted stock unit awards do not have an exercise price. |
| |
(3)
| Includes 872,000 shares for future issuance to current and future employees and directors generally, and 2,021,000 shares for future issuance to current and future employees and directors who were not employees of the Company at the date of the Merger, all of which may be issued pursuant to grants of full-value stock awards. |
EXECUTIVE OFFICERS
The following table lists the executive officers of the Company as of the date hereof and the capacities in which they serve.
|
| | | | | | | | | | | | | |
| Name | | Age | | Position |
| Rick L. Wessel | | 5962 | | Vice-Chairman of the Board and Chief Executive Officer (“CEO”) |
| T. Brent Stuart | | 4851 | | President and Chief Operating Officer (“COO”) |
| R. Douglas Orr | | 5760 | | Executive Vice President, Chief Financial Officer, Secretary and Treasurer (“CFO”) |
| Raul R. Ramos | | 5255 | | Senior Vice President, Latin American Operations |
| Anna M. Alvarado | | 3942 | | General Counsel |
Rick L. Wessel joined the Company in 1992 and has served as chief executive officer since November 2006 and has been a director since November 1992 and the vice-chairman of the Boardboard of Directorsdirectors since September 2016. He previously served as president from May 1998 to September 2016, chairman of the board from October 2010 to September 2016, vice chairmanvice-chairman of the board from November 2004 to October 2010, and secretary and treasurer of the Company from May 1992 to November 2006, and the Company’s chief financial officer from May 1992 to December 2002. Prior to February 1992, Mr. Wessel was employed by Price Waterhouse LLP for approximately nine years.
T. Brent Stuart joined the Company in September 2016 in conjunction with the Merger as the president and chief operating officer. Prior to that, Mr. Stuart served as Cash America’s president and chief executive officer since November 2015, Cash America’s president and chief operating officer from May 2015 through October 2015, and served as Cash America’s executive vice president-chief operating officer from January 2015 through April 2015. Prior to that, Mr. Stuart served as the senior vice president-operations for Cash America’s U.S. retail services storefront lending business from July 2010 to January 2015 and as a regional vice president from November 2008 to July 2010. Prior to joining Cash America, Mr. Stuart held various senior leadership roles in the financial services industry, including the position of vice president with Fremont Investment and Loan from 2006 to 2008, senior vice president with Nationstar Mortgage from 2004 to 2006 and vice president with Novastar Financial, Inc. from 2002 to 2004. He also held various leadership positions with CitiFinancial from 1994 to 2002. Mr. Stuart started his career in financial services with Norwest Finance in May 1992.
R. Douglas Orr joined the Company in July 2002 as the vice president of finance. Since January 2003, Mr. Orr has served as the chief financial officer, and since January 2005, Mr. Orr has also served as executive vice president. In addition, Mr. Orr has served as secretary and treasurer since November 2006. Prior to joining the Company, Mr. Orr spent 14 years at Ray & Berndtson, a global executive search firm, where he served in senior executive and financial management roles. Prior to his employment at Ray & Berndtson, Mr. Orr worked for four years at Price Waterhouse LLP.
Raul R. Ramos joined the Company in 1992 to be in charge oflead the jewelry operations center. Mr. Ramos has served in a progression of operational management roles since he joined the Company, including his current position of senior vice president, Latin American operations and his positions as vice president of operations and other management roles prior to his current role. In this current role, which he has held since May 2013, Mr. Ramos directs all store operations in the Company’s Latin America and South Texas markets. Prior to his employment with the Company, he worked in the pawn and retail jewelry industries.
Anna M. Alvarado joined the Company in 2011 as Associate General Counsel and was promoted to General Counsel in January 2015. Ms. Alvarado leads and directs all aspects of the Company’s legal matters, including government relations in both the U.S. and Latin America. Before joining the Company, she had five years of experience as a trial and litigation attorney with two firms based in Texas. Ms. Alvarado is licensed by the State Bar of Texas and holds a doctors of jurisprudence (JD) and a M.B.A. Before a career in law, she was employed as an accountant.
All officers serve at the discretion of the Board of Directors.
The current NEOsexecutive officers of the Company have significant tenure with the Company and pawn or related industries:industries. The following table summarizes the experience of the executive officers:
| | | | | | | | | | | | | | | | | | | | |
| | | Years of Experience: |
| Name | | FirstCash | | Industry |
| Rick L. Wessel, CEO | | | 29 | | | 29 |
| T. Brent Stuart, COO | | | 12 | (1) | | 28 |
| R. Douglas Orr, CFO | | | 18 | | | 18 |
| Raul R. Ramos, SVP Latin American Operations | | | 28 | | | 33 |
| Anna M. Alvarado, General Counsel | | | 9 | | | 9 |
(1) Mr. Stuart joined the Company in September 2016 in conjunction with the Merger as the president and chief operating officer. Prior to that, Mr. Stuart had been employed by Cash America since 2008.
All officers serve at the discretion of the Board of Directors.
|
| | | | | | |
| | | | Years Experience: |
| Name | | FirstCash | | Industry |
| Rick L. Wessel, CEO | | | 25 | | | 25 |
| T. Brent Stuart, COO | | | 9 | (1) | | 25 |
| R. Douglas Orr, CFO | | | 15 | | | 15 |
| Raul R. Ramos, SVP Latin American Operations | | | 25 | | | 30 |
| Anna M. Alvarado, General Counsel | | | 6 | | | 6 |
| | | | | | | | |
| Mr. Stuart joined the Company in September 2016 in conjunction with the Merger as the president and chief operating officer. Prior to that, Mr. Stuart had been employed by Cash America since 2008. | |
EXECUTIVE COMPENSATION
Compensation Discussion and Analysis
Executive Summary
Compensation Program Overview
The following discussion provides an overview and analysis of the Company’s compensation program and policies, the material compensation decisions it has made under those programs and policies with respect to its top executive officers in relation to the Company’s performance results and the material factors that it considered in making those decisions. This discussion focuses on the compensation awarded to, earned by, and paid to the following individuals who are referred to as the “named executive officers” (NEOs) throughout this Proxy Statement:
Rick L. Wessel, CEO
T. Brent Stuart, COO
R. Douglas Orr, CFO
Raul R. Ramos, SVP Latin American Operations
Anna M. Alvarado, General Counsel
The goal for the FirstCash executive compensation program is to attract, motivate and retain the highest quality executives who will provide leadership for the Company’s growth and success in a dynamic and competitive market. The Company’s overriding compensation philosophy of the Company is to promote a “culture of ownership” among its executives by aligning their interests with those of its stockholders. The specific objectives of the Company’s compensation program’s specific objectivesprograms include:
•Linking pay to Company and individual performance with executive compensation, while not encouraging excessive risk-taking;risk-taking.
•Balancing short- and long-term Company performance with a weighting towards long-term performance; andperformance.
•Aligning executives’ interests with those of stockholders through long-term ownership of Company stock.
The long-term strategy and business plans of FirstCash are focused on growing revenues and income by opening new pawn locations, acquiring existing pawn stores in strategic markets and increasing revenue and operating profits in existing stores. The Company believes the successful execution of these strategies will drive long-term growth in stockholder returns.
The Compensation Committee and the Board of Directors continually reviewsreview and improvesimprove its pay practices for its executive officers (who are referred to in this Proxy Statement as the “named executive officers,” or “NEOs”) to ensure they reward and drive superior performance and align with stockholders’ interests. The Company’s named executive officers for 2020 include:
| | | | | | | | |
| • | Rick L. Wessel | Vice-Chairman of the Board and Chief Executive Officer (CEO) |
| • | T. Brent Stuart | President and Chief Operating Officer (COO) |
| • | R. Douglas Orr | Executive Vice President, Chief Financial Officer, Secretary and Treasurer (CFO) |
| • | Raul R. Ramos | SVP Latin American Operations |
| • | Anna M. Alvarado | General Counsel |
Executive Summary of 2020 Compensation Results
2020 Operating Results, Including Impact of COVID-19
The effects of COVID-19 significantly impacted the Company’s operations and earnings results in both the U.S. and Latin America due to quarantines, shelter-in-place and other orders mandating non-essential business closures, travel restrictions and other measures taken in an effort to reduce the spread of COVID-19. Beginning in the second quarter, in the context of significantly reduced levels of consumer spending, unprecedented levels of government response to the pandemic were undertaken, primarily in the U.S., through direct stimulus payments, enhanced unemployment benefits and forbearance programs in an effort to mitigate the economic impact of the pandemic on consumers.
While resulting pawn loans outstanding decreased by approximately 40% in the U.S. and 36% in Latin America during the second quarter of 2020, the Company was able to keep its stores operating in most markets and remained highly liquid and profitable during the year. Nonetheless, the impact of COVID-19 on pawn lending activity, inventory levels and general business operations caused a significant reduction in most financial/operational metrics during 2020.
The following table presents selected operating results for 2020 compared to 2019 (dollars in thousands, except per share amounts and store counts).
| | | | | | | | | | | | | | | | | | | | | | | | | | | | | |
| 2020 | | 2019 | | Decrease |
| Revenue | $ | 1,631,284 | | | $ | 1,864,439 | | | | (13) | % | |
| Net income | $ | 106,579 | | | $ | 164,618 | | | | (35) | % | |
| Adjusted net income | $ | 125,153 | | | $ | 167,900 | | | | (25) | % | |
| Diluted earnings per share | $ | 2.56 | | | $ | 3.81 | | | | (33) | % | |
| Adjusted diluted earnings per share | $ | 3.01 | | | $ | 3.89 | | | | (23) | % | |
| EBITDA | $ | 213,608 | | | $ | 299,495 | | | | (29) | % | |
| Adjusted EBITDA | $ | 236,974 | | | $ | 303,782 | | | | (22) | % | |
| New store openings | | 75 | | | | 89 | | | | (16) | % | |
The impact of COVID-19 on the Company’s operating results, including pawn lending activity and retail sales, are more fully described in the “2020 Operating Results” section below. The magnitude of these results on revenue and earnings significantly impacted attainment of the performance-based elements of compensation plans established in early 2020 and in prior years for the senior executive officers as more fully described below.
Impact of COVID-19 on Operations
The impact of COVID-19 significantly changed the priorities of the Company as management quickly directed its focus to the safety of its customers and employees, along with other resilience initiatives necessary to operate and support the business during the pandemic. Specific initiatives and efforts included:
•Implementing enhanced safety protocols in all store locations and corporate offices to protect employees and customers.
•Maintaining essential service designations from governmental entities to provide customers uninterrupted access to cash through pawn transactions and allow immediate return of redeemed collateral.
•Providing individuals and businesses with critical home office and remote learning equipment such as laptops, tablets and monitors while also providing customers immediate access to a wide array of in-demand “stay-at-home” products, such as televisions, gaming systems, remodeling tools and sporting goods.
•Rapidly adapting store operations to meet changing customer needs and priorities over the course of the year, including providing loan forbearance for customers impacted by COVID-19.
•Providing enhanced compensation and benefits for store employees for the extra effort required to continue to serve customers in the midst of the pandemic.
•Quickly implementing enhanced remote work and collaboration capabilities for corporate and field management employees in order to maintain full support of store operations.
•Implementing cost reductions in order to maintain profitability despite significant revenue contraction due to the pandemic.
•Maintaining ample short-term liquidity and working capital to support employees and meet customer needs.
At the same time, management remained committed in 2020 to the long-term strategic health and growth of the Company by:
•Focusing on talent retention by not laying off or furloughing any employees in the U.S. and minimal layoffs in Latin America, while continuing to hire and provide training programs in both regions.
•Continuing to invest in new store openings and acquisitions.
•Investing in significant corporate office and data center remodeling projects, in both the U.S. and Mexico, in order to improve the Company’s technology infrastructures and employee working environments.
•Refinancing and amending long-term credit facilities to enhance liquidity, extend term, lower costs and improve covenant structure to facilitate continued investment in new stores and acquisitions.
•Maintaining cash dividends to shareholders at the existing, pre-pandemic level.
•Providing increased shareholder communications and outreach over the course of pandemic.
The Company believes its employees did an outstanding job navigating the challenges of the pandemic and their success can be seen in the Company’s ability to continue serving customers while maintaining strong liquidity, continued profitability and store growth despite the impacts of the pandemic.
Impact of COVID-19 on 2020 Compensation
As further described below, COVID-19 had a significant impact on the Company’s 2020 operating results, including the compensation of the senior executive team. Despite the challenges, the Company was able to maintain full employment and compensation in 2020 for its front-line store level, operational management and corporate employees.
Management made severalspecific staffing and compensation decisions early in the pandemic. These decisions and resulting outcomes, which impacted all store associates, store managers, operations management and non-executive corporate staff during 2020, included the following:
•Provided uninterrupted employment and pay for all eligible U.S. and Mexico employees during the pandemic
•Maintained all employee benefit plans, including matching contributions to the Company’s 401(k) plan
•Provided enhanced sick leave and medical benefits related to COVID-19
•Provided normal cost of living and merit pay increases throughout 2020
•For store employees and operations management:
◦Made frequent mid-cycle adjustments to quarterly incentive and bonus plans throughout 2020 to ensure payout levels at or, in most cases, above normalized payout levels
◦Resulting average per employee incentive program and bonus payouts for 2020 exceeded 2019 results by approximately 26%
•For all corporate employees other than the CEO, COO and CFO, salaries were maintained at normal levels in 2020 and year-end bonuses remained at least equal to amounts paid in 2019
The Company believes these early decisions were important for maintaining employee morale, motivation and substantive changesretention during 2020.
In contrast, compensation decisions for the named executive officers were generally deferred until the Company and the Compensation Committee could more fully assess the full-year impact of COVID-19 on the business and senior management’s responsiveness in itsnavigating the challenges of 2020. While the Compensation Committee believes senior management demonstrated significant responsiveness and resiliency in 2020, given the impact on the Company’s operating results and shareholder returns, resulting compensation programsof the three senior executive officers was significantly reduced in 2020 compared to prior years, and practices in 2017, including:demonstrated proper alignment between pay and performance.
IncreasedThe impact of COVID-19 on 2020 and 2021 compensation for the target percentage of pay from long-term performance-basedthree senior executive officers included the following:
•Short-term incentive awards (“LTIP”) while reducing the target percentage of paycompensation from the 2020 annual performance incentive planprogram (“APIP”) was below target payouts and decreased 30% for the CEO, 21% for the COO and 22% for the CFO compared to 2019 payouts.
•Despite the negative impact on 2020 performance due to COVID-19, performance targets for equity awards under the long-term incentive program (“APIP”LTIP”) granted in 2018 and 2019, which had measurement periods that included 2020 results, were not reduced or otherwise modified by the Compensation Committee.
•While the original 2020 LTIP award granted in January of 2020 was subsequently cancelled and replaced with a new award later in 2020, the considered value of the target compensation from the 2020 replacement award was reduced 17% compared to the original 2020 award.
•The replacement 2020 LTIP award remained 100% performance-based and added a relative TSR metric with a full three-year performance period to further link compensation payouts to shareholder returns. The relative TSR metric is included in the 2021 LTIP, as well.
•While salaries for the CEO, COO and CFO positions (see “At-Risk” Pay Mix chart below)
Modifiedwere increased by 3% annually at the beginning of 2020, an action taken prior to the onset of the COVID-19 pandemic, salaries and target APIP awards for 2021 were not increased for the CEO, COO and CFO as follows:CFO.
| | | | | | | | |
◦ | The target award for the CEO was reduced from 225% to 150% of salary and the maximum award was reduced from 350% to 300% of salary | |
Overall Conclusions
The onset of the COVID-19 pandemic was an unprecedented event whose unexpected impacts were well beyond the control of FirstCash’s senior executive team. However, the Compensation Committee believed the senior executives had a responsibility to effectively manage the Company through the pandemic with the goal of preserving the Company’s operations, safeguarding its employees and customers and positioning the Company so it could thrive and resume the growth and profitability path it had been on over many years prior to the pandemic.
As 2020 progressed, the Board of Directors and the Compensation Committee were engaged with the senior management team as they worked toward the objectives described above. While expected results in 2021 will continue to be impacted by the pandemic, the Compensation Committee believes the Company is well positioned to regain the ongoing growth and profitability expected by shareholders. The Compensation Committee believes the actions undertaken and outcomes achieved in 2020 by the senior executive team were valuable and should be rewarded appropriately.
The 2020 APIP and the 2020-2022 LTIP were originally designed for a company operating in normal business circumstances and not operating in a pandemic mode brought on by COVID-19. The original targets and plan designs would have resulted in no payouts for the senior management team under both the APIP and the LTIP award plans established in January of 2020. However, because the actions undertaken by the senior management team were critical for the Company’s ability to maintain its operations and fully recover in the future, the Compensation Committee determined that payouts for the 2020 APIP and providing for potential future payouts for the 2020-2022 LTIP were appropriate outcomes.
As a result, the Compensation Committee exercised rare, but permitted discretion to provide a payout under the 2020 APIP in an objective manner based on a wide range of resilience factors and replaced the original 2020-2022 LTIP with a new 100% performance-based replacement award, which provides a meaningful and appropriate opportunity for a payout at the conclusion of the associated performance period. Both redesigned programs reflect payouts/potential payouts below the original programs, which illustrates how the Compensation Committee struck a balance between the desire to reward the senior executives for good performance in unusual and strenuous circumstances and the desire to align such incentive arrangements with the interests of shareholders.
These decisions and impacts on compensation are discussed in more detail in the appropriate sections below.
2020 Operating Results
Impact of COVID-19 on Operating Results
The onset of COVID-19 in March 2020 in the U.S. and shortly thereafter in Latin America significantly impacted the Company’s operations and earnings results. Most countries, states and other local government officials reacted by instituting quarantines, shelter-in-place and other orders mandating non-essential business closures, travel restrictions and other measures in an effort to reduce the spread of COVID-19. The measures significantly reduced normal levels of consumer spending, and combined with broad-based stimulus programs and enhanced unemployment benefits in the U.S., provided significant and unprecedented liquidity to many of the Company’s customers, which greatly suppressed normal demand for pawn loans.
Pawn Lending
The combined impacts of reduced consumer spending due to the broad lockdowns, forbearance programs, direct stimulus payments and enhanced unemployment benefits significantly increased customer liquidity in the second quarter. This resulted in a significant decrease in pawn lending activities as customers paid off existing pawn loans and originations of new pawn loans declined sharply. As the broad shutdowns in response to COVID-19 began to ease in the later part of the second quarter, pawn lending activity began to slowly recover throughout the remainder of 2020. Even so, resulting pawn balances at December 31, 2020 were still down 17% compared to the prior-year end. Resulting pawn loan fees were negatively impacted during the second, third and fourth quarters of 2020 as a result of the lower pawn loan balances at the beginning of each quarter with total pawn fees in 2020 declining 19%. The charts below detail the impact of COVID-19 on pawn loan balances and pawn fee revenues:
| | | | | | | | |
◦ | The target awards for the COO and CFO positions were reduced from 165% to 125% |
| |
◦ | Maintained earnings per share and EBITDA as the primary performance measures and added strategic measures for meeting integration milestones and cost synergies related to the Merger |
Modified the LTIP for the CEO, COO and CFO as follows:
| |
◦ | Added a three-year cumulative performance period to replace the prior years’ series of stacked one-year performance periods |
| |
◦ | Established adjusted net income as the earnings target, a measure which is not impacted by stock repurchases |
| |
◦ | Eliminated a duplicative adjusted EBITDA measure from the LTIP, while retaining the measure in the APIP |
| |
◦ | Added a second discreet performance measure for long-term store additions to the LTIP, while eliminating it as a measure in the APIP |
| |
◦ | Provided for a range of outcomes in the 2017 LTIP grants (i.e., a performance range between defined threshold and maximum performance parameters) versus the prior year grant’s single point outcomes (i.e., either the target performance was met and payouts were made or target performance was not met and no payouts were made) |
| |
◦ | Used adjusted net income and total store additions as the performance measures for the 2017 LTIP grant, recognizing that cumulative net income over a three-year period would likely be closely followed by stockholders and have an impact on long-term stockholder returns, while growth in store locations would be a key driver of future long-term growth and profitability |
In assessing its performance for internal and external reporting purposes, the Company reviews certain key performance measures which include:Retail Sales
Revenue growth, including constant currency results;
Net income and diluted earnings per share growth and related adjusted measures;
Adjusted EBITDA (Adjusted earnings before net interest expense, tax expense, depreciation expense and amortization expense);
Cash flow from operations and adjusted free cash flow;
Store count additions from both de-novo store openings and acquisitions; and
Total stockholder return.
The Company’s long-term strategyretail sales in 2020 were impacted by COVD-19 as well. In most markets where the Company operates, pawnshops were designated as “essential businesses” and business plans are focused on growing revenuesremained open during the broad shutdowns in response to COVID-19. As a result, retail sales during the second quarter were higher than in the prior-year quarter, with strong customer demand for “stay-at-home” products such as consumer electronics and operating profits by addingsporting goods. However, the increased retail volumes and less forfeited inventory from lower pawn locations by acquiring existing pawn stores and opening new storesreceivables negatively impacted inventory balances in strategic markets and increasing operating profits in its existing stores. Duringthe second half of the year which negatively impacted retail sales during the third quarter of 2016,and fourth quarters. For the Company completed the Merger with Cash America, which was the largest U.S. pawnshop operator with more than 800 stores in 20 U.S. states. With the Merger, the Company expanded its U.S. footprint from 14 states to afull year, total of 26 states and during fiscal 2016, the Company increased the total store count 94%retail sales declined 9% compared to the prior year. GivenThe charts below detail inventory balances and retail sales over the significant store countpast eight quarters and the percentage change over the respective prior-year quarter:
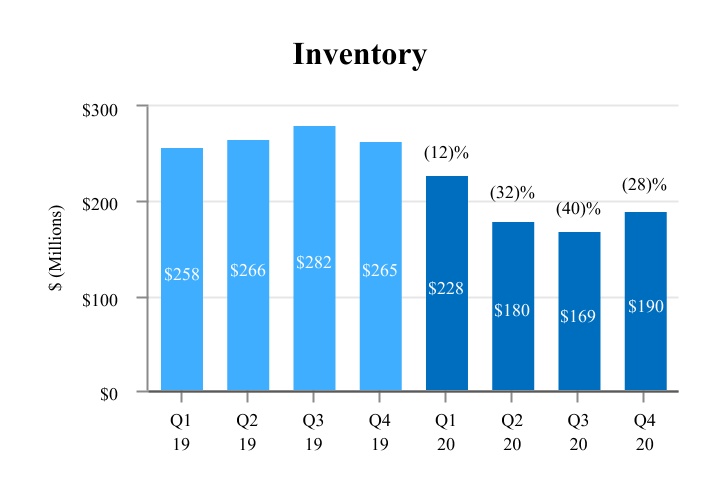
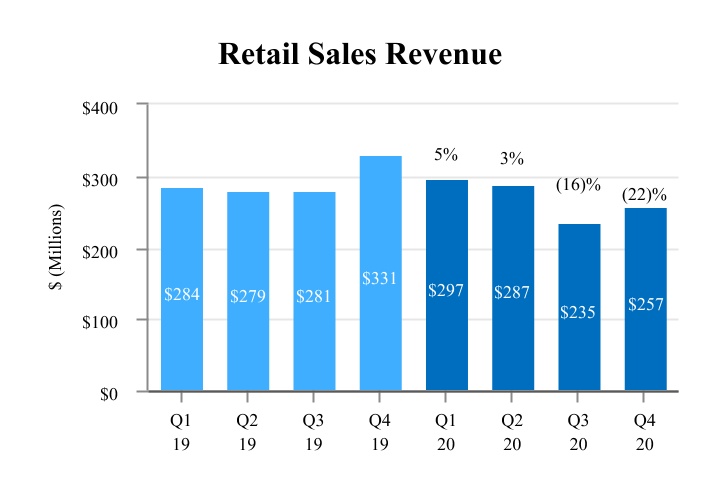
Partially offsetting the decline in retail sales was an increase in fiscal 2016,retail sales margin, which was primarily a result of continued retail demand for pre-owned merchandise, increased buying of merchandise directly from customers and lower levels of aged inventory, all of which limited the need for normal discounting.
The Company was also able to realize significant cost savings in the second half of 2020, primarily by reduced staffing levels achieved through attrition and limiting store operating hours. Additional savings were realized through significantly reduced travel expenses, lower variable compensation costs for senior management and other initiatives.
Please refer to the Company’s focus during fiscal 2017 was2020 Annual Report on Form 10-K for further information about the impact of COVID-19 on the successful integration of the Cash America stores into the merged Company in the U.S. and the addition of retail pawn locations in Latin America. The Company achieved the following milestones during fiscal 2017:Company.
| | | | | | | | |
▪ | Achieved a record $1.8 billion in total revenues |
| |
▪ | Successfully completed the conversion of all the Cash America stores to the FirstPawn point of sale and loan management system and realized approximately $62 million in run-rate administrative cost synergies driven by the Merger integration |
| |
▪ | Added 53 total store locations, primarily through de-novo openings in Latin America |
| |
▪ | Saw the total market capitalization of the Company at December 31, 2017 increase to approximately $3.2 billion, up 39% compared to the prior year |
Operating Results
Summary of 2020 Key Performance Measures
Revenue and Store Growth
:
The Company has a long history of consistent revenue and earnings growth, with declines in 2020 almost exclusively due to the impact of COVID-19. The following table illustrates both as reported and constant currency total revenue for eachcharts detail key performance metrics, many of the three years ended December 31, 2017 and the store locations operated by the Company at the end of each of these years. Constant currency results, which are considered non-GAAP measurements of financial performance, exclude the effects of foreign currency translation and are calculated by translating current-year results at prior-year average exchange rates (see Appendix A for further details).
Revenue growth highlights for the fiscal year ended December 31, 2017:
Total revenue for fiscal 2017 was a record $1.8 billion, an increase of 64% on a reported and constant currency basis compared to the prior year
U.S. segment revenues increased 92% in 2017, reflecting contributions from the Merger with Cash America
Revenues for fiscal 2017utilized as measures in the Latin America segment increased 17% on a dollar-translated basis and increased 18% on a constant currency basisCompany’s performance-based compensation plans for its senior executive officers:
While the Company was primarily focused on integrating the more than 800 Cash America stores since the Merger, the Company added a significant number of additional locations during the fiscal year ended December 31, 2017: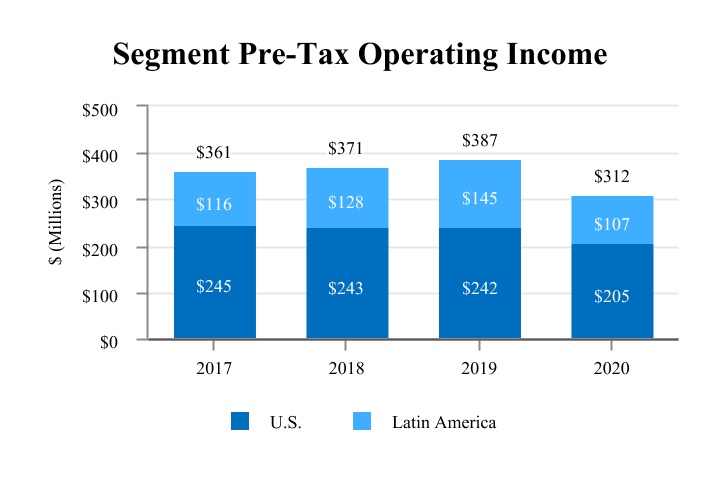
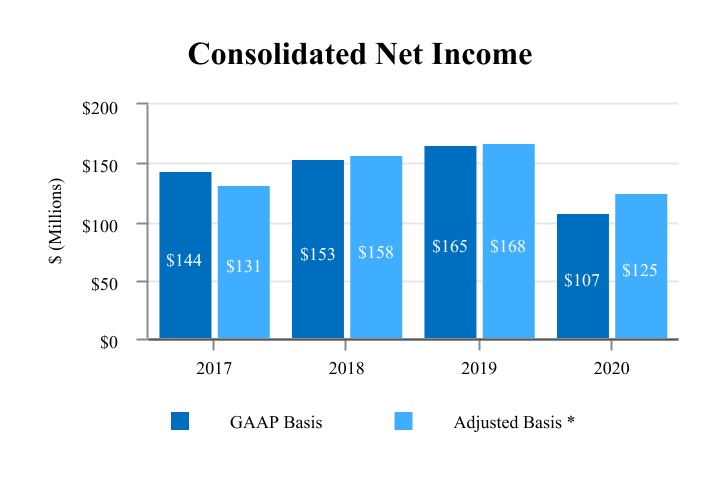
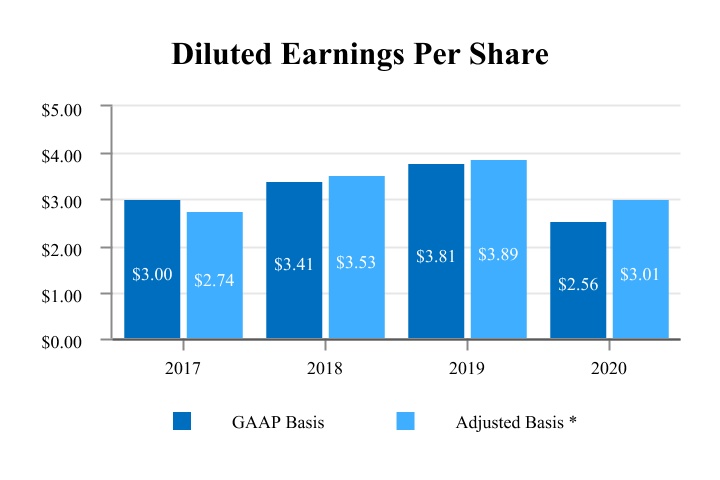
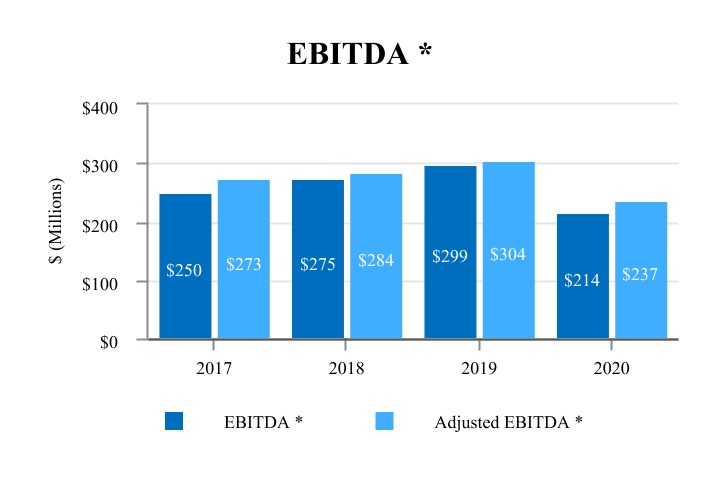
A total of 53 stores were added in fiscal 2017:
| |
◦ | 50 new and acquired pawn stores in Latin America |
| |
◦ | 3 new and acquired pawn stores in the U.S. |
Net store additions have grown at a compound annual growth rate of 28% over the past three years
Earnings Results:
The following tables illustrate net income, adjusted net income, EBITDA and adjusted EBITDA for each of the three years ended December 31, 2017. Adjusted net income, EBITDA and adjusted EBITDA are non-GAAP measures and are calculated in the* Non-GAAP financial measure. See detailed reconciliation of non-GAAP financial measures provided in Appendix A.
Earnings growth highlightsDespite the significant decline in revenues and profitability in 2020 due to COVID-19, the Company still achieved substantial profitability outcomes, earning more than $300 million in segment pre-tax operating income, net income greater than $100 million and adjusted EBITDA of nearly $240 million. Such profit levels gave the Company the ability to protect its employees and customers, provide ongoing essential services and strengthen the Company for the fiscal year ended December 31, 2017:long-term once the impact of COVID-19 dissipates.
Store Openings
While the Company added 137 stores in 2020 and reached a total store count of almost 2,750 locations, COVD-19 reduced the pace of new store openings and store count growth compared to prior years given numerous logistical challenges it presented during the year. In addition, the Company made the strategic decision to exit the consumer lending business in 2020, which resulted in higher than normal store closure levels and limited the net income increased 139%, driven primarily by revenue growthincrease in the store count in 2020. The charts below detail store additions and Merger synergies. GAAP net income also reflected a net $27 million income tax benefit due tototal store count over the passagepast four years:
Balance Sheet and Cash Flows
Despite the impacts of the Tax Cutspandemic, the Company’s balance sheet and Jobs Act (“Tax Act”) partially offsetcash flows remained strong during 2020. In August 2020, the Company refinanced its senior notes at a significantly lower interest rate while extending the maturity from 2024 to 2028. Even with the store openings, acquisitions and share repurchases during 2020, the Company reduced year-end net debt outstanding by $6$31 million compared to a year ago. The Company believes its balance sheet and cash flows can support the expected further recovery in Merger related expensespawn loans and $9 millioninventories and fund continued store growth, while also maintaining its dividend and stock repurchase programs.
In summary, the Company focused first on employee and customer safety during 2020 and made it a priority to retain the skilled workforce necessary to support the business as it recovers. Management gained significant experience in debt extinguishment costs.
Adjusted net income increased 54% basedmanaging the business through the challenges of the COVID-19 pandemic. It learned how to operate the business more efficiently in many ways, such as operating with reduced, but faster turning inventories, which generated higher gross retail margins. Additionally, management focused on incremental earnings inoptimizing both the U.S.store and Latin Americacorporate operating costs from which it will continue to realize savings and administrative cost synergiesmaintain higher long-term profit margins as a result of integration activities. Adjusted net income excludesthese initiatives.
Role of the net tax benefit, Merger related expensesCompensation Committee
The Compensation Committee reviews and debt extinguishment costs discussed above.administers the compensation program for the Company’s executive officers, including recommending to the Board of Directors for approval of the specific compensation of all of the NEOs. Compensation is typically set at the first Compensation Committee meeting each calendar year after reviewing performance for the past year and prospects for the year ahead. The Compensation Committee regularly meets with the CEO, COO and CFO, who provide insight into how individual executives are performing. The Compensation Committee retains broad flexibility in the administration of the Company’s compensation plans.
EBITDA for 2017 totaled $250 million,
The Compensation Committee has the authority to engage outside advisors to assist the Compensation Committee in the performance of its duties. In particular, the Compensation Committee has sole authority to retain and terminate any compensation consultant to assist in the evaluation of director, CEO or senior executive compensation, including sole authority to approve such consultant’s reasonable fees and other retention terms, all at the Company’s expense.
The Compensation Committee’s Use of an increaseIndependent Consultant
The Compensation Committee retained the services of 73% over fiscal 2016,Pay Governance, an independent compensation advisory firm, to advise the Compensation Committee on various aspects of the Company’s compensation program. The Compensation Committee assessed Pay Governance's independence, as required under Nasdaq listing rules. Based on this review, the Compensation Committee does not believe any conflict of interest existed with the work performed by Pay Governance and adjusted EBITDA totaled $273 million, an increase of 52% over fiscal 2016.considers them to be independent.
GAAP diluted earnings per share increased 74%, while adjusted earnings per share increased 12% over the prior year.
| | | | | | | | |
◦ | Adjusted net income excludes a $0.57 per share net income tax benefit offset by $0.31 per share in Merger related expenses and debt extinguishment costs. | |
Pay Governance worked with the Compensation Committee and management to develop the 2020 peer group (“2020 Peer Group”) discussed below and made recommendations on revising the target amounts and maximum payouts under the proposed 2020 annual cash and equity-based incentive plans and also provided recommendations on the performance metrics included in the 2020 incentive plans. Additionally, Pay Governance presented periodic updates on trends and developments across the executive compensation landscape to management and the Compensation Committee.
Role of the CEO in Executive Compensation Decisions
The Company’s CEO works closely with the Compensation Committee, providing his assessment and recommendations on the competitiveness of the programs and the performance of the other NEOs and makes recommendations for consideration pertaining to the compensation of the NEOs. The Compensation Committee takes these recommendations into consideration and either approves or works with the CEO to develop suitable proposals. The CEO does not, however, participate in discussions and decisions about his own compensation.
Peer Group Benchmarking
The Compensation Committee analyzes the compensation practices of a group of peer companies, consisting of other publicly-traded companies primarily in the pawn, specialty consumer finance and specialty retail industries. All of the peer companies are within a range of market cap and revenue size similar to the Company. In determining compensation for its NEOs, each element of its compensation program is compared against the published compensation data of its 2020 Peer Group and other compensation surveys. The Compensation Committee, while mindful of this peer group and survey data, has not established a specific range of compensation for any element of pay from the peer group, but instead uses the data as a general guideline for discussion and consideration. The overall goal of this process is to enable the Company to provide total compensation packages competitive with prevailing practices in the Company’s industry and within the Company’s peer group.
The Compensation Committee engaged Pay Governance to help construct the 2020 Peer Group in late 2019 and early 2020. The following specific factors, among other things, were considered during the construction of the 2020 Peer Group:
•Market capitalization
•Revenue
•Geographic footprint (specifically with international operations in Latin America)
•Customer base (specifically serving value-conscious retail consumers and/or credit-challenged borrowers)
•Regulatory environment (specifically in highly regulated pawn, consumer finance and other financial services industries)
The Compensation Committee believes the lack of a significant number of public pawnshop competitors creates difficulty in constructing a direct peer group. Accordingly, the 2020 Peer Group is constructed with input from Pay Governance using a broader group of companies which are generally indicative of the underbanked, cash-constrained and value-conscious retail consumer that make up the majority of the Company’s customer base and which are also aligned with the increasing size and complexity of the organization. The Compensation Committee used the 2020 Peer Group to benchmark executive and director compensation levels and practices.
| | | | | | | | |
◦ | Earnings per share growth rates were also impacted by the issuance of 20,181,000 shares of common stock in September 2016 as a result of the Merger, impacting the weighted-average share counts on a comparative basis. The weighted-average diluted shares outstanding for fiscal 2017 and 2016 were 47,888,000 and 35,004,000, respectively. | |
GAAP net income has grown at a compound annual growth rate of 19% over the past three years and adjusted net income has grown at a compound annual growth rate of 18% over the same three-year period.
Over the past three years, EBITDA and adjusted EBITDA have grown at a compound annual growth rate of 19% and 23%, respectively.
Cash Flow Results:
The Compensation Committee established the following tables illustrate cash flow from operating activities and adjusted free cash flowgroup of peer companies for eachbenchmarking compensation for 2020:
| | | | | | | | | | | | | | |
| 2020 Peer Group | | Industry | | Geographic Focus |
| Pawnshop Companies: | | | | |
| EZCORP, Inc. | | Pawnshop operator | | United States, Latin America |
| | | | |
| Consumer Finance and Related Service Companies: | | | | |
| Credit Acceptance Corporation | | Specialty consumer finance | | United States |
| Encore Capital Group, Inc. | | Specialty consumer services | | Worldwide (including Latin America) |
| Green Dot Corporation | | Specialty consumer finance | | United States |
| H&R Block, Inc. | | Specialty consumer services | | United States, Canada, Australia |
| OneMain Holdings, Inc. | | Specialty consumer finance | | United States |
| PRA Group, Inc. | | Specialty consumer services | | United States, Canada, Europe |
| | | | |
| Retail and Related Consumer Companies: | | | | |
| Aaron’s, Inc. | | Specialty retail/consumer finance | | United States, Canada |
| Big Lots, Inc. | | Specialty retail | | United States |
| Cinemark Holdings, Inc. | | Consumer entertainment | | United States, Latin America |
| DSW Inc. | | Specialty retail | | United States |
| Five Below, Inc. | | Specialty retail | | United States |
| Rent-A-Center, Inc. | | Specialty retail/consumer finance | | United States, Canada, Latin America, Puerto Rico |
| Sally Beauty Holdings, Inc. | | Specialty retail | | North America, Latin America, Europe |
| Six Flags Entertainment Corporation | | Consumer entertainment | | United States, Latin America, Canada |
The Compensation Committee, with the assistance of Pay Governance, reviewed the composition of the three years ended December 31, 2017. Adjusted free cash flow is2020 Peer Group. As a non-GAAP measureresult of the review, Rent-A-Center, Inc. and is calculatedSix Flags Entertainment Corporation were added, while Conn’s, Inc. was removed in order to more closely align the detailed reconciliationCompany’s 2020 Peer Group with that of non-GAAP financial measures provided in Appendix A.the U.S. proxy advisory organizations.
Cash flow from operating activities and adjusted free cash flow growth highlights for the fiscal year ended December 31, 2017:
Cash flow from operating activities increased 128% compared to the prior year, totaling $220 million
Adjusted free cash flow was a record $231 million in 2017, an increase of 240% over the prior year
Over the past three years, adjusted free cash flow has grown at a compound annual growth rate of 48%
Cash flow from operating activities and adjusted free cash flow are commonly used by investors as a measure of cash generated by business operations that may be used to repay scheduled debt maturities and debt service or may be available to invest in future growth.
Total Stockholder Return:
The following table, illustrates totalbased on data compiled by Pay Governance as of December 31, 2019, shows a comparison of FirstCash’s market cap, revenues, assets and relative percentile rank to the 2020 Peer Group (dollars in millions):
| | | | | | | | | | | | | | | | | | | | |
| | 2020 Peer Group Median | | FirstCash | | FirstCash Percentile of 2020 Peer Group |
| Market cap | | $2,125 | | $3,441 | | 56th |
| Revenues | | $2,670 | | $1,864 | | 45th |
| Assets | | $2,883 | | $2,439 | | 42nd |
2020 Say on Pay Vote and Shareholder Dialogue
At the Company’s 2020 Annual Meeting of Stockholders, the stockholders approved the 2019 compensation of the NEOs with 96% of the votes cast in favor of the Company’s compensation programs. The Company’s senior executives meet regularly with significant stockholders, and during 2020 did not receive substantive comments or inquiries regarding concerns around the compensation programs. Given the strong stockholder returnsupport for the five, threeCompany’s compensation programs evidenced by the 2020 say on pay vote and one-year periods ended December 31, 2017 forthe lack of direct comment from stockholders, the Company did not engage in a specific outreach program with stockholders regarding changes to its executive compensation program. Future advisory votes on executive compensation will serve as comparedan additional tool to guide the S&P Small Cap 600 indexBoard of Directors and the companiesCompensation Committee in evaluating the diversified financials GICS code 4020, whichalignment of the Company’s executive compensation program with the interests of the Company is included in:and its stockholders.
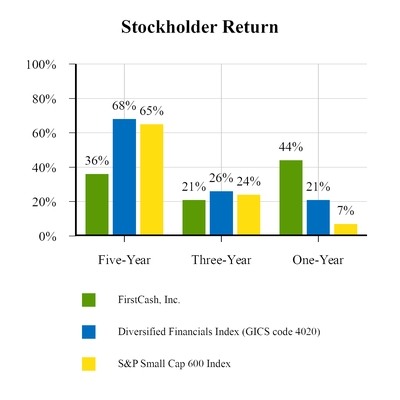
Elements of Compensation
The Company’s stockholder return significantly outperformed the comparative indices in fiscal 2017.
principal focus is on total direct compensation, which includes a smaller guaranteed portion and a larger at-risk portion. The Company believes the three-year and five-year stockholder returns comparedtypes of compensation paid to the general indices were negatively impacted due to the significant decline in the translated valueNEOs currently consists of the currency in Mexico over the respective measurement periods. The average value of the Mexican peso relative to the U.S. dollar has decreased by 44%, 42% and 1% over the most recent five, three and one year fiscalsalary, annual periods, respectively.
Impact of Performance on Executive Compensation
Overall, the 2017 results were outstanding, as the Company exceeded significantly its adjusted earnings per share and adjusted EBITDA targets. In addition, the Company completed multiple key Merger integration targets and significantly surpassed initial administrative synergy estimates. As a result, the Company delivered total stockholder returns of 44% for fiscal year 2017. The performance-related payouts under the compensation plansperformance-based cash incentives for the CEO, COO and CFO, directly reflected these strong performance resultsannual cash bonuses for NEOs other than the CEO, COO and achievementCFO, and long-term incentive compensation (primarily in the form of performance-based restricted stock units as well as time-based restricted stock units for NEOs other than the CEO, COO and CFO). The following table summarizes the key elements of compensation in 2020 for the CEO, COO and CFO:
| | | | | | | | | | | | | | | | | |
| Salary | | Annual Performance
Incentive Program (“APIP”) | | Long-Term
Incentive Program (“LTIP”) |
| Form of compensation | Cash | | Cash | | Equity — Performance-Based Restricted Stock |
| Type | Fixed | | Performance-based | | Performance-based |
| Purpose | Fixed pay | | Drive short-term financial performance and growth | | Drive long-term growth, align management interests with those of stockholders and promote retention |
| Performance period | Ongoing | | 1 year | | 3 years |
| Performance measures | N/A | | • Adjusted earnings per share
• Adjusted EBITDA
• Net revenue growth | | • Adjusted net income
• Store growth
• Relative shareholder return |
| Performance determination | Based in part on individual performance, experience and expertise | | Formulaic | | Formulaic |
“At-Risk” Pay Mix
A significant integration milestones.portion of the compensation for the Company’s NEOs is in the form of at-risk variable compensation. All annual cash awards and the majority of equity awards are variable under objective, performance-based plans with the only significant element of fixed compensation being the NEO’s salary. The Company does not provide for other supplemental retirement plans or other non-qualified plans, which are typically not performance-based. Accordingly, the Company believes the pay mix for the NEOs appropriately aligns their interests with those of its stockholders.
The mix of compensation plan payoutselements at target award levels for the CEO used in 2017 reflected a proper alignment between pay and performance.2020 is as follows:
Key Features of the Executive Compensation Program
The Compensation Committee is mindful of evolving practices in executive compensation and corporate governance. The table below highlights the Company’s current executive compensation practices—both the practices it believes will drive performance and mitigate risk (left column) and the practices it has not implemented or eliminated because it does not believe they would serve stockholders’ long-term interests (right column).
|
| |
What The Executive Compensation Program Does: | What The Executive Compensation Program Does Not Do: |
Emphasizes an appropriate mix of cash and equity, annual and long-term compensation and fixed and variable pay. All annual and long-term incentive plans for the top three executives are 100% performance-based | Does not provide for annual cash incentive compensation payouts based on a single performance metric |
Pays senior executives salaries commensurate with their backgrounds, years of experience, special skill sets and competitive practice | Does not provide guaranteed salary increases for the top three senior executives |
Provides annual cash incentive awards which are tied directly to Company performance based primarily on earnings metrics and secondarily upon attainment of quantifiable strategic objectives | Does not contemplate discretionary cash awards to the top three senior executives |
Provides annual grants of long-term performance-based equity awards based on attainment of cumulative long-term profitability and growth targets
Equity awards are forfeited if the executive leaves the Company voluntarily or is terminated for cause before the vesting date, which is generally three years from the date of grant for the senior executives
| Does not provide for automatic, time-based vesting of equity awards for the top three senior executives
Does not allow repricing of underwater stock options without stockholder approval
Has not and does not contemplate out of cycle incentive awards or equity grants to senior executives
|
Change in control provisions for the senior executive officers have "double trigger" severance and equity benefits in the event of involuntary termination following a change in control in exchange for a two year non-compete and non-solicitation agreement | Does not provide for excise tax gross up protection for executives upon a change in control |
Caps the maximum annual incentive award and long-term performance award for the top three executives and provides minimum performance thresholds below which no incentive awards are granted | Does not provide for automatic minimum payout awards for annual or long-term performance awards; all incentives must be earned by the top three executives based on performance criteria |
Senior executives participate in the same 401(k) retirement plan as all other domestic employees and receive modest perquisites with a sound business rationale | Does not provide supplemental retirement plans, non-qualified deferred compensation plans or other excessive executive perquisites |
Subjects all incentive-based compensation to a “clawback” policy that allows the Company, in the event of a restatement of its financial results, to recover excess amounts erroneously paid to NEOs under certain circumstances | Does not encourage unnecessary or excessive risk taking as a result of the Company’s compensation policies |
Provides that NEOs and directors are subject to robust stock ownership guidelines | Does not allow for hedging of Company stock |
Role of the CEO in Executive Compensation CommitteeDecisions
The Compensation Committee reviews and administers the compensation program for the Company’s executive officers, including recommending to the Board of Directors for approval of the specific compensation of all of the NEOs. Compensation is typically set at the first Compensation Committee meeting each calendar year after reviewing performance for the past year and prospects for the year ahead. The Compensation Committee regularly meets with the CEO COO and CFO, who provide insight into how individual executives are performing. The Compensation Committee retains broad flexibility in the administration of the Company’s compensation plans.
The Compensation Committee has the authority to engage outside advisors to assist the Compensation Committee in the performance of its duties. In particular, the Compensation Committee has sole authority to retain and terminate any compensation consultant to assist in the evaluation of director, CEO or senior executive compensation, including sole authority to approve such consultant’s reasonable fees and other retention terms, all at the Company’s expense.
The Committee’s Use of an Independent Consultant
The Compensation Committee retained the services of Pay Governance, an independent advisor, to advise the Compensation Committee on various aspects of the Company’s compensation program. The Compensation Committee assessed Pay Governance's independence, as required under NYSE listing rules. Based on this review, the Compensation Committee does not believe any conflict of interest existed with the work performed by Pay Governance and consider them to be independent.
Pay Governance workedworks closely with the Compensation Committee, providing his assessment and management to develop the 2017 peer group (“2017 Peer Group”) discussed below, provided assistance in evaluating the new employment agreements for Messrs. Wessel, Stuart and Orr in the context of the Merger and made recommendations on revising the targets and maximums under the proposed 2017 annual cash and equity-based incentive plans and also provided recommendations on the competitiveness of the programs and the performance metrics includedof the other NEOs and makes recommendations for consideration pertaining to the compensation of the NEOs. The Compensation Committee takes these recommendations into consideration and either approves or works with the CEO to develop suitable proposals. The CEO does not, however, participate in the 2017 incentive plans. These discussions resulted in annual and long-term incentive plans that were entirely performance-based and covering a variety of revenue, profitability and strategic goals and objectives for 2017.decisions about his own compensation.
Peer Group Benchmarking
The Compensation Committee analyzes the compensation practices of a group of peer companies, consisting of other publicly-traded companies primarily in the pawn, specialty consumer finance industry or theand specialty retail industry. Theindustries. All of the peer companies are within a range of market cap and revenue size similar to the Company.In determining compensation for its NEOs, each element of its compensation program is compared against the published compensation data of its peer group.2020 Peer Group and other compensation surveys. The Compensation Committee, while mindful of this peer group and survey data, has not established a specific range of compensation for any element of pay from the peer group, but ratherinstead uses the data as a general guideline for discussion and consideration. The overall goal of this process is to enable the Company to provide total compensation packages competitive with prevailing practices in the Company’s industry and within the Company’s peer group.
The 2016 Peer Group was established in 2015 and was based on revenues and market cap of the Company before the Merger. The Merger was a transformational transaction for the Company that significantly increased the Company’s revenues and market cap. The table below illustrates the significance of the Merger, which was completed September 1, 2016, and the size of the post-Merger company (dollars in thousands):
|
| | | | | | | | | |
| | December 31, 2017 | December 31, 2016 | December 31, 2015 |
| Revenues | $ | 1,780,000 |
| $ | 1,088,000 |
| $ | 705,000 |
|
| Market capitalization | $ | 3,164,000 |
| $ | 2,280,000 |
| $ | 1,057,000 |
|
| Number of employees | 17,000 |
| 16,200 |
| 8,600 |
|
The Compensation Committee engaged Pay Governance to help construct a 2017the 2020 Peer Group based on the increased sizein late 2019 and complexity of the Company as a result of the Merger.early 2020. The following specific factors, among other things, were considered during the construction of the 2017 peer group:2020 Peer Group:
•Market capitalization (specifically considering the increased size of the Company after the Merger)
•Revenue (specifically considering the increased size of the Company after the Merger)
•Geographic footprint (specifically with international operations in Latin America)
•Customer base (specifically serving value-conscious retail consumers and/or credit-challenged borrowers)
•Regulatory environment (specifically in highly regulated pawn, consumer finance and other financial services industries)
Based on the input of Pay Governance, the Compensation Committee established the following group of peer companies for benchmarking compensation for 2017:
|
| | | | |
2017 Peer Group | | Industry | | Geographic Focus |
Pawnshop Companies: | | | | |
EZCORP, Inc. | | Pawnshop operator | | United States, Latin America, Canada |
| | | | |
Consumer Finance Companies: | | | | |
Encore Capital Group, Inc. | | Specialty consumer finance | | Worldwide (including Latin America) |
H&R Block, Inc. | | Specialty consumer services | | United States, Canada, Australia |
OneMain Holdings, Inc. | | Specialty consumer finance | | United States |
PRA Group, Inc. | | Specialty consumer finance | | United States, Canada, Europe |
Santander Consumer USA Holdings Inc. | | Specialty consumer finance | | United States |
SLM Corporation | | Specialty consumer finance | | United States |
| | | | |
Retail Companies: | | | | |
Aaron’s, Inc. | | Specialty retail/consumer finance | | United States, Canada |
Cinemark Holdings, Inc. | | Movies and entertainment | | United States, Latin America |
DSW Inc. | | Specialty retail | | United States |
Five Below, Inc. | | Specialty retail | | United States |
Outerwall Inc. | | Specialty retail | | United States, Canada, Puerto Rico, Ireland, United Kingdom |
Rent-A-Center, Inc. | | Specialty retail/consumer finance | | United States, Canada, Latin America,
Puerto Rico
|
Sally Beauty Holdings Inc. | | Specialty retail | | North America, Latin America, Europe |
The Compensation Committee believes the lack of a significant number of public pawnshop competitors creates difficulty in constructing a direct peer group. The Compensation Committee further believesAccordingly, the 20172020 Peer Group is constructed with input from Pay Governance using a broader group of companies which are generally indicative of the underbanked, cash-constrained and value-conscious retail consumer that make up the Company targets, is more closelymajority of the Company’s customer base and which are also aligned with the increasing size and complexity of the post-Merger organization and is a good reference group for theorganization. The Compensation Committee used the 2020 Peer Group to considerbenchmark executive and director compensation levels and practices.
The Compensation Committee established the following group of peer companies for benchmarking compensation for 2020:
| | | | | | | | | | | | | | |
| 2020 Peer Group | | Industry | | Geographic Focus |
| Pawnshop Companies: | | | | |
| EZCORP, Inc. | | Pawnshop operator | | United States, Latin America |
| | | | |
| Consumer Finance and Related Service Companies: | | | | |
| Credit Acceptance Corporation | | Specialty consumer finance | | United States |
| Encore Capital Group, Inc. | | Specialty consumer services | | Worldwide (including Latin America) |
| Green Dot Corporation | | Specialty consumer finance | | United States |
| H&R Block, Inc. | | Specialty consumer services | | United States, Canada, Australia |
| OneMain Holdings, Inc. | | Specialty consumer finance | | United States |
| PRA Group, Inc. | | Specialty consumer services | | United States, Canada, Europe |
| | | | |
| Retail and Related Consumer Companies: | | | | |
| Aaron’s, Inc. | | Specialty retail/consumer finance | | United States, Canada |
| Big Lots, Inc. | | Specialty retail | | United States |
| Cinemark Holdings, Inc. | | Consumer entertainment | | United States, Latin America |
| DSW Inc. | | Specialty retail | | United States |
| Five Below, Inc. | | Specialty retail | | United States |
| Rent-A-Center, Inc. | | Specialty retail/consumer finance | | United States, Canada, Latin America, Puerto Rico |
| Sally Beauty Holdings, Inc. | | Specialty retail | | North America, Latin America, Europe |
| Six Flags Entertainment Corporation | | Consumer entertainment | | United States, Latin America, Canada |
The Compensation Committee, with the assistance of Pay Governance, reviewed the composition of the 2020 Peer Group. As a result of the review, Rent-A-Center, Inc. and Six Flags Entertainment Corporation were added, while Conn’s, Inc. was removed in benchmarking executive compensation. order to more closely align the Company’s 2020 Peer Group with that of the U.S. proxy advisory organizations.
The following table, below, based on data compiled by Pay Governance as of December 31, 2016,2019, shows a comparison of FirstCash’s market cap, revenues, assets and relative percentile rank on market cap and revenues to the 20172020 Peer Group:Group (dollars in millions):
| | | | | | | | | | | | | | | | | | | | |
| | 2020 Peer Group Median | | FirstCash | | FirstCash Percentile of 2020 Peer Group |
| Market cap | | $2,125 | | $3,441 | | 56th |
| Revenues | | $2,670 | | $1,864 | | 45th |
| Assets | | $2,883 | | $2,439 | | 42nd |
2020 Say on Pay Vote and Shareholder Dialogue
At the Company’s 2020 Annual Meeting of Stockholders, the stockholders approved the 2019 compensation of the NEOs with 96% of the votes cast in favor of the Company’s compensation programs. The Company’s senior executives meet regularly with significant stockholders, and during 2020 did not receive substantive comments or inquiries regarding concerns around the compensation programs. Given the strong stockholder support for the Company’s compensation programs evidenced by the 2020 say on pay vote and the lack of direct comment from stockholders, the Company did not engage in a specific outreach program with stockholders regarding changes to its executive compensation program. Future advisory votes on executive compensation will serve as an additional tool to guide the Board of Directors and the Compensation Committee in evaluating the alignment of the Company’s executive compensation program with the interests of the Company and its stockholders.
|
| | | | | | | |
| | 2017 Peer Group Percentile |
Market Cap | | |
Revenues | | 36th
|
Elements of Compensation
In setting
The Company’s principal focus is on total direct compensation, which includes a smaller guaranteed portion and a larger at-risk portion. The types of compensation paid to the target payNEOs currently consists of salary, annual performance-based cash incentives for the 2017CEO, COO and CFO, annual cash bonuses for NEOs other than the CEO, COO and CFO, and long-term incentive compensation program,(primarily in the Committee relied on a benchmarking analysis prepared byform of performance-based restricted stock units as well as time-based restricted stock units for NEOs other than the CEO, COO and CFO). The following table summarizes the key elements of compensation in 2020 for the CEO, COO and CFO:
| | | | | | | | | | | | | | | | | |
| Salary | | Annual Performance
Incentive Program (“APIP”) | | Long-Term
Incentive Program (“LTIP”) |
| Form of compensation | Cash | | Cash | | Equity — Performance-Based Restricted Stock |
| Type | Fixed | | Performance-based | | Performance-based |
| Purpose | Fixed pay | | Drive short-term financial performance and growth | | Drive long-term growth, align management interests with those of stockholders and promote retention |
| Performance period | Ongoing | | 1 year | | 3 years |
| Performance measures | N/A | | • Adjusted earnings per share
• Adjusted EBITDA
• Net revenue growth | | • Adjusted net income
• Store growth
• Relative shareholder return |
| Performance determination | Based in part on individual performance, experience and expertise | | Formulaic | | Formulaic |
“At-Risk” Pay Governance, which indicated the CEO’s target compensation was at the 44Mix
th percentile
A significant portion of the target pay ofcompensation for the 2017 Peer Group.
Pay Governance reviewed the composition of the 2017 Peer GroupCompany’s NEOs is in the fallform of 2017. As a resultat-risk variable compensation. All annual cash awards and the majority of equity awards are variable under objective, performance-based plans with the review, Outerwall was removed becauseonly significant element of fixed compensation being the NEO’s salary. The Company does not provide for other supplemental retirement plans or other non-qualified plans, which are typically not performance-based. Accordingly, the Company believes the pay mix for the NEOs appropriately aligns their interests with those of its acquisition by Apollo Group and Big Lots, a U.S.-based specialty retailer, was added to createstockholders.
The mix of compensation elements at target award levels for the 2018 Peer Group. This group wasCEO used by the Compensation Committee to evaluate pay decisions in 20182020 is as follows:
Role of the CEO in Executive Compensation Decisions
The Company’s CEO works closely with the Compensation Committee, providing his assessment and recommendations on the competitiveness of the programs and the performance of the other NEOs and makes recommendations for consideration pertaining to the compensation of the NEOs. The Compensation Committee takes these recommendations into consideration and either approves or
works with the CEO to develop suitable proposals. The CEO does not, however, participate in provide input for or make recommendationsdiscussions and decisions about his own compensation.
2017Peer Group Benchmarking
The Compensation Committee analyzes the compensation practices of a group of peer companies, consisting of other publicly-traded companies primarily in the pawn, specialty consumer finance and specialty retail industries. All of the peer companies are within a range of market cap and revenue size similar to the Company. In determining compensation for its NEOs, each element of its compensation program is compared against the published compensation data of its 2020 Peer Group and other compensation surveys. The Compensation Committee, while mindful of this peer group and survey data, has not established a specific range of compensation for any element of pay from the peer group, but instead uses the data as a general guideline for discussion and consideration. The overall goal of this process is to enable the Company to provide total compensation packages competitive with prevailing practices in the Company’s industry and within the Company’s peer group.
The Compensation Committee engaged Pay Governance to help construct the 2020 Peer Group in late 2019 and early 2020. The following specific factors, among other things, were considered during the construction of the 2020 Peer Group:
•Market capitalization
•Revenue
•Geographic footprint (specifically with international operations in Latin America)
•Customer base (specifically serving value-conscious retail consumers and/or credit-challenged borrowers)
•Regulatory environment (specifically in highly regulated pawn, consumer finance and other financial services industries)
The Compensation Committee believes the lack of a significant number of public pawnshop competitors creates difficulty in constructing a direct peer group. Accordingly, the 2020 Peer Group is constructed with input from Pay Governance using a broader group of companies which are generally indicative of the underbanked, cash-constrained and value-conscious retail consumer that make up the majority of the Company’s customer base and which are also aligned with the increasing size and complexity of the organization. The Compensation Committee used the 2020 Peer Group to benchmark executive and director compensation levels and practices.
The Compensation Committee established the following group of peer companies for benchmarking compensation for 2020:
| | | | | | | | | | | | | | |
| 2020 Peer Group | | Industry | | Geographic Focus |
| Pawnshop Companies: | | | | |
| EZCORP, Inc. | | Pawnshop operator | | United States, Latin America |
| | | | |
| Consumer Finance and Related Service Companies: | | | | |
| Credit Acceptance Corporation | | Specialty consumer finance | | United States |
| Encore Capital Group, Inc. | | Specialty consumer services | | Worldwide (including Latin America) |
| Green Dot Corporation | | Specialty consumer finance | | United States |
| H&R Block, Inc. | | Specialty consumer services | | United States, Canada, Australia |
| OneMain Holdings, Inc. | | Specialty consumer finance | | United States |
| PRA Group, Inc. | | Specialty consumer services | | United States, Canada, Europe |
| | | | |
| Retail and Related Consumer Companies: | | | | |
| Aaron’s, Inc. | | Specialty retail/consumer finance | | United States, Canada |
| Big Lots, Inc. | | Specialty retail | | United States |
| Cinemark Holdings, Inc. | | Consumer entertainment | | United States, Latin America |
| DSW Inc. | | Specialty retail | | United States |
| Five Below, Inc. | | Specialty retail | | United States |
| Rent-A-Center, Inc. | | Specialty retail/consumer finance | | United States, Canada, Latin America, Puerto Rico |
| Sally Beauty Holdings, Inc. | | Specialty retail | | North America, Latin America, Europe |
| Six Flags Entertainment Corporation | | Consumer entertainment | | United States, Latin America, Canada |
The Compensation Committee, with the assistance of Pay Governance, reviewed the composition of the 2020 Peer Group. As a result of the review, Rent-A-Center, Inc. and Six Flags Entertainment Corporation were added, while Conn’s, Inc. was removed in order to more closely align the Company’s 2020 Peer Group with that of the U.S. proxy advisory organizations.
The following table, based on data compiled by Pay Governance as of December 31, 2019, shows a comparison of FirstCash’s market cap, revenues, assets and relative percentile rank to the 2020 Peer Group (dollars in millions):
| | | | | | | | | | | | | | | | | | | | |
| | 2020 Peer Group Median | | FirstCash | | FirstCash Percentile of 2020 Peer Group |
| Market cap | | $2,125 | | $3,441 | | 56th |
| Revenues | | $2,670 | | $1,864 | | 45th |
| Assets | | $2,883 | | $2,439 | | 42nd |
2020 Say on Pay Vote and Shareholder Dialogue
At the Company’s 20172020 Annual Meeting of Stockholders, the stockholders approved the 2019 compensation of the NEOs with 90%96% of the votes cast in favor of the Company’s compensation programs. Additionally, theThe Company’s senior executives meet regularly with significant stockholders, and during 20172020 did not receive substantive comments or inquiries regarding concerns around the compensation programs. Given the strong stockholder support for the Company’s compensation programs evidenced by the 20172020 say on pay vote and the lack of direct comment from stockholders, the Company did not engage in a specific outreach program with stockholders regarding changes to its executive compensation program. However, as discussed herein, the Company did make significant enhancements to its executive compensation programs following the Merger, which were implemented in 2017 to further align the compensation programs with stockholders’ interests. Future advisory votes on executive compensation will serve as an additional tool to guide the Board of Directors and the Compensation Committee in evaluating the alignment of the Company’s executive compensation program with the interests of the Company and its stockholders.
Elements of Compensation
The Company’s principal focus is on total direct compensation, which includes a smaller guaranteed portion and a larger at-risk portion. The types of compensation paid to the NEOs currently consists of salary, annual performance-based cash incentives for the CEO, COO and CFO, annual cash bonuses tofor NEOs other than the CEO, COO and CFO, and long-term incentive compensation (primarily in the form of performance-based restricted stock units as well as time-based restricted stock units for NEOs other than the CEO, COO and CFO). The following table summarizes the key elements of compensation in 2020 for the CEO, COO and CFO:
| | | | | | | | | | | | | | | | | |
| Salary | | Annual Performance
Incentive Program (“APIP”) | | Long-Term
Incentive Program (“LTIP”) |
| Form of compensation | Cash | | Cash | | Equity — Performance-Based Restricted Stock |
| Type | Fixed | | Performance-based | | Performance-based |
| Purpose | Fixed pay | | Drive short-term financial performance and growth | | Drive long-term growth, align management interests with those of stockholders and promote retention |
| Performance period | Ongoing | | 1 year | | 3 years |
| Performance measures | N/A | | • Adjusted earnings per share
• Adjusted EBITDA
• Net revenue growth | | • Adjusted net income
• Store growth
• Relative shareholder return |
| Performance determination | Based in part on individual performance, experience and expertise | | Formulaic | | Formulaic |
“At-Risk” Pay Mix
A significant portion of the compensation for the Company’s NEOs is in the form of at-risk variable compensation. The Company believes this appropriately alignsAll annual cash awards and the interestsmajority of its NEOsequity awards are variable under objective, performance-based plans with those of its stockholders. For the CEO, COO and CFO, the only significant element of fixed compensation is theirbeing the NEO’s salary. All annual cash awards and all equity awards are variable under objective, performance-based plans. The Company does not grant time vested awards to these individuals nor does it provide for other supplemental retirement plans or other non-qualified plans, which are typically not performance-based. Accordingly, the Company believes the pay mix for the NEOs appropriately aligns their interests with those of its stockholders.
For 2017, the Compensation Committee significantly increased the percentage of the CEO’s target compensation tied to long-term performance incentives and reduced the percentage of performance-based compensation tied to short-term incentives in order to better align CEO and stockholder interests. The mix of compensation elements at target award levels for the CEO used in fiscal 2017 as compared to 2016 are2020 is as follows:
Key Features of the Executive Compensation Program
The Compensation Committee is mindful of evolving practices in executive compensation and corporate governance. The table below highlights the Company’s current executive compensation practices—both the practices it believes will drive performance and mitigate risk (left column) and the practices it has not implemented or eliminated because it does not believe they would serve stockholders’ long-term interests (right column).
| | | | | |
| What The Executive Compensation Program Does: | What The Executive Compensation Program Does Not Do: |
| Emphasizes an appropriate mix of cash and equity, annual and long-term compensation and fixed and variable pay. All 2020 annual and long-term incentive programs for the top three executives are 100% performance-based | Does not provide for annual cash incentive compensation payouts based on a single performance metric, reducing compensation program risk as a result |
| Pays senior executives’ salaries commensurate with their backgrounds, years of experience, special skill sets and competitive practice | Does not provide guaranteed salary or target incentive award increases for the top three senior executives |
| Provides annual cash incentive awards which are tied directly to Company performance based primarily on revenue and earnings-based metrics | Does not normally contemplate discretionary cash awards to the top three senior executives but does recognize there may be situations when discretion can and should be exercised in the context of unusual and unanticipated circumstances |
Provides annual grants of long-term performance-based equity awards based on attainment of cumulative long-term growth targets for net income and store additions along with relative total shareholder returns
Equity awards are forfeited if the executive leaves the Company voluntarily or is terminated for cause before the vesting date, which is generally three years from the date of grant for the senior executives | Does not allow repricing of underwater stock options without stockholder approval
Does not dilute the Company’s stockholders with excessive equity grants to employees. The Company’s 2020 “burn rate,” or stock awards granted (assuming achievement of target award) as a percentage of the weighted-average common shares outstanding, was 0.35% |
| Change in control provisions for the senior executive officers have "double trigger" severance and equity benefits in the event of involuntary termination following a change in control in exchange for a two-year non-compete and non-solicitation agreement | Does not provide for “single-trigger” severance upon a change in control or excise tax gross up protection for executives in connection with a change in control |
| Caps the maximum annual incentive award and long-term performance award for the top three executives and provides minimum performance thresholds below which no incentive awards are granted, serving to manage compensation program risk | Does not provide for automatic minimum payout awards for annual or long-term performance awards |
| Senior executives participate in the same 401(k) retirement plan as all other domestic employees and receive modest perquisites with a sound business rationale | Does not provide supplemental retirement plans, non-qualified deferred compensation plans or other excessive executive perquisites |
| Subjects all incentive-based compensation to a “clawback” policy that allows the Company, in the event of a restatement of its financial results, to recover excess amounts erroneously paid to NEOs under certain circumstances | Does not encourage unnecessary or excessive risk taking as a result of the Company’s compensation policies |
| Provides that NEOs and directors are subject to robust stock ownership guidelines | Does not permit hedging of Company stock |
Salary
The Company offers what it believes to be competitive salaries to its NEOs. The salary must be sufficient to attract and retain talented executives and provide a secure base of cash compensation. In addition, salary levels for the Company’s NEOs are set at levels the Compensation Committee believes to be, based on its general business experience and review of peer company data, competitive in relation to the salary levels of executive officers in the Company’s peer group, taking into consideration the NEO’s position, tenure, responsibility and need for special expertise. In setting the CEO’s salary in particular, the Compensation Committee believes Mr. Wessel’s long tenure with the Company and the significant complexity of operating over 2,700 pawn locations in five countries warrants a salary above the median for the peer group.
Annual salary increases, typically determined in January of each year, are not assured for the three most senior NEOs and adjustments to salariesguaranteed. Salary increases, if any, take into account subjective factors such as the executive’s performance against job expectations, changes in the market, and increased job responsibilities and experience.
For 2017,The following table details each NEO’s salary amounts for 2020, 2019 and 2018:
| | | | | | | | | | | | | | | | | | | | | | | | | | | | | | | | |
| | 2020 | | 2019 | | 2018 |
| NEO | | Base Salary | | % Change Over Prior-Year Period | | Base Salary | | % Change Over Prior-Year Period | | Base Salary |
| Rick L. Wessel, CEO | | $ | 1,210,250 | | | 3 | % | | $ | 1,175,000 | | | — | % | | $ | 1,175,000 | |
| T. Brent Stuart, COO | | 746,750 | | | 3 | % | | 725,000 | | | — | % | | 725,000 | |
| R. Douglas Orr, CFO | | 695,250 | | | 3 | % | | 675,000 | | | — | % | | 675,000 | |
| Raul R. Ramos, SVP Latin American Operations | | 454,230 | | | 3 | % | | 441,000 | | | 5 | % | | 420,000 | |
| Anna M. Alvarado, General Counsel | | 540,750 | | | 3 | % | | 525,000 | | | 5 | % | | 500,000 | |
The 2020 salary increases were made in January 2020, prior to the CEO’simpact of COVID-19. The CEO, COO and CFO did not receive salary was increased by 2% from $1,050,000 to $1,075,000. For the past five years, the compound annual growth rate in the CEO’s salary was 3%. The average salary increase in 2017increases for the other NEOs was 22%, which is significantly greater than the Company’s historical range of annual salary increases. The adjustments for 2017 reflected the significantly increased size and complexity of the post-Merger organization and the expanded responsibilities for these executives in particular.2021.
Short-Term Incentive Compensation
The Company’s short-term incentive plans for the NEOs are intended to drive annual operating and financial results deemed crucial to the Company’s success.
Annual Performance Incentive Plan Enhancements for 2017Program
- In conjunction with the Merger in September 2016, the Compensation Committee engaged Pay Governance to develop and propose modifications to the APIP for the CEO, COO and CFO beginning in 2017. Based on the recommendations of Pay Governance and the work of the Compensation Committee, the following changes were approved and implemented for the 2017 APIP:
The target award for the CEO was reduced from 225% to 150% of salary and the maximum award was reduced from 350% to 300% of salary
The target awards for the COO and CFO positions were reduced from 165% to 125% of salary and the maximum awards were reduced from 250% to 200% of salary
Earnings measures (earnings per share and EBITDA) were designated to remain as the primary performance measures. The Compensation Committee added additional strategic, objectively measured performance targets related to technology integration milestones and cost synergies related to the Merger
Annual Performance Incentive Plan - For 2017, the CEO, COO and the CFO wereare granted opportunities to earn annual incentive compensation through the APIP. The APIP provides for the payment of annual cash incentive compensation based upon the achievement of performance goals established annually by the Compensation Committee, based on one or more specified objective performance criteria.
To determine amounts earned under the APIP,measures. The performance targets are established by the Compensation Committee measuresusing the performanceannual operating plan, inclusive of the Company against an annual business planestimated stock repurchases, prepared by management and reviewed and approved by the Board of Directors at the beginning of the fiscaleach year. The Company’s level of achievement of the performance goals set forth in the annual businessoperating plan which are inclusive of estimated stock repurchases, will result in the payment of a cash incentive award equal to a percentage of the salary of the participating NEO.
The APIP performance measures and goals are reviewed and approved annually by the Compensation Committee and are designed to reinforce the Company’s focus on profitability and enhancement of long-term stockholder value. The participants may earn annual cash incentives between 0% and a stated maximum percentage of their respective salary.salary, which remained consistent with prior year at 300% for the CEO and 200% for the COO and CFO. The range of percentages for each participating NEO are based on the scope of the officer’s responsibilities, internal pay equity among participating NEOs with similar responsibilities and competitive considerations, and are reviewed annually by the Compensation Committee.
For fiscal 2017,
In January 2020, the Compensation Committee established performance goals as the following performance measures and weightings for the APIP (see the detailed reconciliation of non-GAAP financial measures in Appendix A):2020 APIP:
| | | | | | | | |
| Performance Measure | | Weight |
| Adjusted diluted earnings per share | | 40% |
| Adjusted EBITDA | | 40% |
| Growth in Latin America operations segment net revenue (on a constant currency basis) | | 20% |
Adjusted earnings per share
Adjusted EBITDA
Cash America point of sale and loan management system store conversion
Merger administrative cost synergy amounts
The Compensation Committee believes the nature and mixweighting of these targets providesthe performance measures should provide an appropriate mix of short-term measurestargets directed primarily toat earnings targets (adjusted earnings per share and adjusted EBITDA) and other Merger integration targets. growth:
•The adjusted earnings per share targetperformance measure represents the performance metric which the Compensation Committee believes most impacts stockholder returns over a one-year period.
•The adjusted EBITDA targetperformance measure is also focused on the achievement of earnings metrics,growth, but excludes the impact of share repurchases, financing activities and tax strategies, resulting in a pure measure of coreoperating profitability.
•The Compensation Committee alsogrowth in Latin America net revenue performance measure is focused on growth in what the Company believes the conversionis its most significant and key growth market, and where it has focused much of Cash America stores to the FirstPawn point of saleits store opening and loan management system and achieving certain Merger administrative cost synergy targets are important short-term strategic goals necessary for the long-term, successful integration of Cash America with the merged Company.acquisition activity.
The following table sets forth the weighting ofthreshold, target and maximum performance goals for each performance measure and each participant’sthe actual performance achieved during 2020:
| | | | | | | | | | | | | | | | | | | | | | | | | | | | | | | | | | | | | | |
| | 2020 Performance Range | | 2020
Actual Performance |
| Performance Measure | | Threshold | | Target | | Maximum | |
| Adjusted diluted earnings per share | | $ | 3.90 | | | $ | 4.15 | | | $ | 4.40 | | | $ | 3.01 | |
| Adjusted EBITDA | | $ | 300,415 | | | $ | 314,944 | | | $ | 329,473 | | | $ | 236,974 | |
| Percentage growth (decrease) in Latin America operations segment net revenue (constant currency) | | 7.0 | % | | 9.5 | % | | 12.0 | % | | (8.0) | % |
The significant impact of COVID-19 on the Company’s business, as described in the 2020 Operating Results section above, resulted in the Company failing to achieve threshold target and maximum payout opportunities, as a percentage of their salary,performance levels for eachthe year under all three performance measures of the 20172020 APIP.
Actions Taken By The Compensation Committee Related to the APIP
By the end of the second quarter of 2020, it was apparent the Company would fail to achieve any of the threshold performance levels under the 2020 APIP. Given the uncertainty and instability caused by COVID-19 and the difficulty in predicting the impact on the Company’s business for the remainder of 2020, the Compensation Committee believed it was impractical to attempt a mid-year revision to the APIP performance measures:measures, weightings or goals. Instead, the Compensation Committee, along with its advisor, Pay Governance, began developing a comprehensive scorecard to assess management’s performance during the year to determine whether to use its discretion to address the unforeseen disruption of COVID-19 to the Company’s business.
In the deliberations of the Compensation Committee, it was agreed and emphasized that the use of discretion in calculating an award using a different set of criteria was made in response to very specific and unusual circumstances in 2020 and was not intended to be a recurring methodology for future APIP award programs.
The Compensation Committee considered resilience actions taken by management to enable the Company to weather the significant disruption and uncertainty caused by COVID-19 (including safeguarding the health and safety of the Company’s employees and customers) and position the Company for success as economic conditions improve upon the end of the pandemic. To assist in this review, management shared with the Compensation Committee its views on the critical priorities for the Company for the balance of the year following the outbreak of COVID-19.
|
| | | | | | | | | | | | | | | | | | | | | | | | | | | | | | |
| | | Diluted Adjusted Earnings Per Share | | Adjusted EBITDA | | Number of Cash America Stores Converted to FirstPawn Point of Sale and Loan Management System | | Merger-Related Administrative Cost Synergy Amounts | | Total |
| | | CEO | | COO/CFO | | CEO | | COO/CFO | | CEO | | COO/CFO | | CEO | | COO/CFO | | CEO | | COO/CFO |
| Weighting | | 40% | | 30% | | 15% | | 15% | | 100% |
Threshold (1) | | 24 | % | | 20 | % | | 18 | % | | 15 | % | | 9 | % | | 7.5 | % | | 9 | % | | 7.5 | % | | 9 | % | | 7.5 | % |
| Target | | 60 | % | | 50 | % | | 45 | % | | 37.5 | % | | 22.5 | % | | 18.8 | % | | 22.5 | % | | 18.8 | % | | 150 | % | | 125 | % |
| Maximum | | 120 | % | | 80 | % | | 90 | % | | 60 | % | | 45 | % | | 30 | % | | 45 | % | | 30 | % | | 300 | % | | 200 | % |
| | | | | | | | |
| No award is earned if actual performance is less than this threshold amount. | |
In settingBelow are the specific performance targets for 2017,identified resilience factors and the actions management took during the year to respond to the unprecedented disruption caused by COVID-19 that were considered by the Compensation Committee considered the expected growthto guide its use of discretion and assess management’s performance in earnings due to the Merger and other store additions, partially offset by expected impacts of currency translation and the decline in the non-core consumer lending revenues on the adjusted earnings per share and adjusted EBITDA targets. The earnings per share target also included an estimate of earnings accretion from stock repurchases. The earnings accretion from actual stock repurchases in 2017 was consistent with the estimate used to establish the target. In 2017, 27%context of the Company’s total revenues were from operations in Latin America, primarily in Mexico where the functional currency is the Mexican peso. As a result, changes in the value of the Mexican peso against the U.S. dollar can significantly impact the Company’s U.S. dollar-reported revenues and earnings. The Company does not believe it is appropriate to hedge its foreign currency exposure as it does not repatriate foreign profits back to the U.S. Rather, the Company uses its foreign earnings and cash flows to fund the opening and acquisition of new stores in these foreign markets. In addition, the Company continues to de-emphasize consumer lending operations because of increasing internet-based competition and regulatory constraints. The impacts of currency translation and the expected decline in earnings from non-core consumer lending activities on the 2017 APIP adjusted earnings per share and adjusted EBITDA growth targets are as follows (dollars in thousands except per share amounts):APIP:
| | | | | | | | |
| Area of Focus | Key Resilience Indicators | Initiatives and Outcomes |
| Human capital | Employee safety | • Implemented and enforced robust safety protocols and COVID-19 tracking in all stores and corporate offices |
| • Eliminated most travel and in-person meetings Company-wide |
| • Provided employees with enhanced sick leave and COVID-19 medical reimbursements |
| • Provided remote work options and social distancing protocols for corporate employees |
| Continuity of workforce | • Did not layoff or furlough any employees in the U.S. Minimal layoffs or furloughs in Latin America (less than 5% of workforce) which were tied to government-enforced restrictions or closures in those markets |
| • Provided enhanced human resources support, employee communications and training programs |
| • Maintained 401(k) plan matching contributions and amended plan to permit easier hardship distributions |
| Compensation efforts | • Provided normal salary increases and maintained store-level incentive and bonus programs |
| • Provided real-time, mid-cycle adjustments to incentive and bonus targets to reflect impact of COVID-19 on operating results |
| • Increased average per employee store incentive program and bonus payouts by approximately 26% compared to prior year to reflect additional work required to safely operate the stores |
| Customer service | Maintain essential services | • Obtained essential service designations in the U.S. and Mexico, allowing stores to stay open during the pandemic |
| Safety and security protocols | • Enhanced social distancing, sanitizing and cleaning protocols in all stores |
| • Installed protective barriers in stores and limited customer traffic when necessary |
| Customer accommodation/loan forbearance | • Provided extended payment options for customers unable to get to stores |
| Financial operations | Maintain short-term liquidity | • Immediate outreach and communications to existing U.S. line of credit bank group |
| • Amended U.S. unsecured line of credit to provide additional covenant flexibility and reduce unused fees |
| • Obtained new unsecured bank line of credit in Mexico |
| • Suspended share buybacks during the second and third quarters of 2020 |
| Extend and increase long-term financing | • Successfully refinanced and upsized senior unsecured notes |
| • Added four additional years to maturity (2024 to 2028) |
| Reduce borrowing costs | • Reduced interest rate on senior unsecured notes from 5.375% to 4.625% |
| • Negotiated a 35% reduction in the unused fee on the U.S. line of credit from 50 bps to 32.5 bps |
| | |
| | |
|
| | | | | | | | | | | | | | | | | | | | | | | | |
| | | Adjusted Earnings Per Share | | Adjusted EBITDA |
| | | Threshold (1) | | Target | | Maximum | | Threshold (1) | | Target | | Maximum |
| 2016 Actual results | | $ | 2.44 |
| | $ | 2.44 |
| | $ | 2.44 |
| | $ | 180,252 |
| | $ | 180,252 |
| | $ | 180,252 |
|
| | | | | | | | | | | | | | | | | | | |
| Stated 2017 APIP performance targets | | $ | 2.40 |
| | $ | 2.55 |
| | $ | 2.80 |
| | $ | 252,000 |
| | $ | 264,000 |
| | $ | 282,000 |
|
| Target growth rate 2017 vs 2016 | | (2 | )% | | 5 | % | | 15 | % | | 40 | % | | 46 | % | | 56 | % |
| Considered adjustments: | | | | | | | | | | | | | | | | | | |
Estimated currency translation headwind (2) | | $ | 0.19 |
| | $ | 0.19 |
| | $ | 0.19 |
| | $ | 9,501 |
| | $ | 9,501 |
| | $ | 9,501 |
|
Estimated non-core consumer lending contraction (2) | | $ | 0.03 |
| | $ | 0.03 |
| | $ | 0.03 |
| | $ | 1,616 |
| | $ | 1,616 |
| | $ | 1,616 |
|
| Adjusted 2017 APIP performance targets | | $ | 2.62 |
| | $ | 2.77 |
| | $ | 3.02 |
| | $ | 263,117 |
| | $ | 275,117 |
| | $ | 293,117 |
|
Adjusted target growth rate 2017 vs 2016 (3) | | 7 | % | | 14 | % | | 24 | % | | 46 | % | | 53 | % | | 63 | % |
| | | | | | | | |
| No award is earned if actual performance is less than this threshold amount. | |
| | | | | | | | |
| Area of Focus | Key Resilience Indicators | Initiatives and Outcomes |
| Profitability Initiatives | Gross margin improvements | • Realized significant retail margin improvements in the U.S. and Mexico (430 and 230 basis points, respectively) |
| Store operating expense reductions | • Successfully reduced store operating hours and optimized hiring rates |
| • Achieved a 6% reduction in store operating expenses to partially offset revenue reductions |
| Other cost saving initiatives | • Significantly reduced overall travel and meeting expenses |
| • Generated significant savings in bank fees through initiation of new banking relationships |
| Long-term strategic initiatives | Store openings and acquisitions | • Opened 75 new stores in Latin America despite the impact of COVID-19 |
| • Acquired 40 stores in Mexico and 22 stores in the U.S. |
| Real estate initiatives | • Capitalized on opportunities in the commercial real estate market to reduce real estate costs and/or upgrade locations and facilities |
| Technology initiatives | • Rapid deployment of new tools to support remote work and video conferencing |
| • Completed relocation and upgrade of the Company’s data center |
| • Accelerated implementation of IP-based video surveillance systems across the store base |
| Consumer lending operations | • Completed the exit from non-core unsecured consumer lending operations in June 2020 |
| Shareholders | Increased communication with shareholders | • Provided more frequent and robust interim public updates to investors regarding key lending and retail trends |
| • Conducted a record amount of investor outreach, almost entirely done via video conferencing |
| Shareholder returns | • Maintained quarterly cash dividend payments at pre-pandemic level |
| • Resumed stock buyback program in the fourth quarter of 2020 |
The Compensation Committee concluded the contributions by the Company’s executives in the key resilience areas were substantial, and through management’s efforts, the Company’s performance exceeded internal expectations in many areas. The Committee noted senior management had ensured compensation at or better than prior-year levels for almost all store level and corporate employees. The Compensation Committee recognized, however, that shareholders and other stakeholders were meaningfully impacted by the Company’s financial performance during 2020.
Compensation Committee’s Use of Discretion and 2020 APIP Awards Granted
In consideration of management’s performance related to the key resilience factors, the Compensation Committee determined that funding up to, but not over, 100% of the original target award would be appropriate for the assessed level of resiliency demonstrated by the Company and senior management. Members of the Compensation Committee and other Board members, excluding the CEO, completed detailed resiliency scorecards in December 2020, which were reviewed again in January 2021 once final annual results were obtained, to assess senior management’s performance for the criteria outlined above. Based on the final results of the resiliency scorecards as tabulated by the chair of the Compensation Committee, the Compensation Committee determined to set the funding factor at 94.5% of the original target award, which the Compensation Committee believed struck an appropriate balance between acknowledging the impact of COVID-19 on the operating results of the Company and fairly compensating the senior executives for their critical efforts in responding to the unprecedented disruption caused by COVID-19.
| | | | | | | | |
| Amount represents the mid-point of the range provided in the Company’s February 2017 press release in the Form 8-K dated February 2, 2017. |
| |
(3)
| Adjusted earnings per share growth rates were also impacted by the issuance of 20,181,000 shares of common stock in September of 2016 as a result of the Merger, impacting the weighted-average share counts on a comparative basis. The weighted-average diluted shares outstanding for fiscal 2017 and 2016 were 47,888,000 and 35,004,000, respectively. Adjusted EBITDA growth rates are not impacted by the weighted-average shares outstanding. |
The following table shows the APIP awards granted by the Compensation Committee to the CEO, COO and CFO for 2020 using the resilience scorecard calculation described above (dollars in thousands):
| | | | | | | | | | | | | | | | | | | | |
| Senior Executive Officers | | Target Incentive Award | | Resilience Initiatives Attained | | Actual Incentive Award |
| Rick L. Wessel, CEO | | $ | 1,815,375 | | | 94.5 | % | | $ | 1,715,529 | |
| T. Brent Stuart, COO | | 933,438 | | | 94.5 | % | | 882,098 | |
| R. Douglas Orr, CFO | | 869,063 | | | 94.5 | % | | 821,264 | |
The 2020 payout amounts provided under this calculation represented a significant reduction, 30% for the CEO, compared to payouts earned under the APIP in prior years. The Compensation Committee believes this is an appropriate outcome given the reductions in revenues and profitability that after consideringoccurred as a result of the adjustments as detailed herein,impact of COVID-19 on the Company, offset by outstanding management efforts to contain the impact and position the Company for future growth rate targets represented a significant degree of rigor.and profitability.
The following table sets forthchart details the performance goals forAPIP award paid over the past four years to each of the 2017 APIP performance measures, the actual performance achieved and the related percentage of each participant’s salary earned (dollars in thousands except per share amounts)participating NEO (in thousands):
|
| | | | | | | | | | | | | | | | | | | | | | |
| | | Performance Goals | | 2017 Actual | | Percent of Base Salary Earned |
| Performance Measure | | Threshold (1) | | Target | | Maximum | | Performance | | CEO | | COO/CFO |
| Adjusted diluted earnings per share | | $ | 2.40 |
| | $ | 2.55 |
| | $ | 2.80 |
| | $ | 2.74 |
| | 106 | % | | 72 | % |
| Adjusted EBITDA | | $ | 252,000 |
| | $ | 264,000 |
| | $ | 282,000 |
| | $ | 273,159 |
| | 67 | % | | 49 | % |
| Number of Cash America stores converted to FirstPawn point of sale and loan management system | | 550 |
| | 625 |
| | 700 |
| | 740 |
| | 45 | % | | 30 | % |
| Merger administrative cost savings targets | | $ | 33,000 |
| | $ | 36,000 |
| | $ | 40,000 |
| | $ | 42,012 |
| | 45 | % | | 30 | % |
| Total percent of salary earned | | | | | | | | | | 263 | % | | 181 | % |
| |
(1)
| No award is earned if actual performance is less than this threshold amount. |
The Compensation Committee believes the payouts earned under APIP for 2017 accurately reflect the Company’s strong operating results and significant progress towards integration milestones.
In total, the CEO was awarded 263% of his salary compared to a target of 150% and maximum potential award of 300%. The COO and CFO were each awarded 181% of their respective salaries compared to a target of 125% and a maximum potential award of 200%.
For the two primary performance measures, adjusted earnings per share and adjusted EBITDA, the Company achieved 107% and 103% of the target amount, respectively. The actual performance exceeded the upper end of Company’s initial earnings guidance ranges for 2017 which the Company believes contributed in part to significant stock price appreciation during 2017.
The targeted conversion of 625 Cash America stores to the FirstPawn system was significantly exceeded as the Company converted 740 stores in 2017, which fully completed the point-of-sale integration process. The Company also achieved significant administrative cost savings in 2017 as total realized savings of $42 million significantly exceeded the targeted cost savings of $36 million. The Company believes attainment of these integration milestones were important short-term goals necessary for the long-term, successful integration of Cash America with the merged Company.
The Compensation Committee believes stockholders shared in the growth and strong performance as demonstrated by the 44% total stockholder return in 2017. As a result,Because the Compensation Committee believes the levels of compensation deliveredutilized its discretion to the most senior executives under the APIP plan reflects appropriate pay levels givenmodify the performance and integration achievements during 2017.
The Compensation Committee also believescriteria of the historical payout levelsoriginal 2020 APIP award, under SEC rules, the 2020 APIP demonstrate an appropriate level of rigor in setting the annual performance goals. Over the last five years, the participantsaward is classified as a “Bonus” rather than “Non-Equity Incentive Plan Compensation” in the plan have achieved the maximum payout in only one year. The average payout as a percentage of the maximum payout was 56% for the CEO and 60% for the COO/CFO roles. The following table details each participant’s threshold and maximum payout opportunities and the actual percentage of each participant’s salary earned for the performance measures established by theSummary Compensation Committee over the past five years:
|
| | | | | | | | | | | | | | | | | | | | | | | | | | | | | | | |
| | 2017 | | 2016 | | 2015 | | 2014 | (2) | | 2013 |
| | CEO | | COO (1) / CFO | | CEO | | CFO | | CEO | | CFO | | CEO | | CFO | | CEO | | CFO |
| Threshold | 9 | % | | | 7.5 | % | | | 3 | % | | 3 | % | | 4 | % | | 3 | % | | 3 | % | | 3 | % | | 25 | % | | 25 | % |
| Maximum | 300 | % | | | 200 | % | | | 350 | % | | 250 | % | | 350 | % | | 250 | % | | 350 | % | | 250 | % | | 350 | % | | 200 | % |
| Actual | 263 | % | | | 181 | % | | | 350 | % | | 250 | % | | 100 | % | | 100 | % | | 179 | % | | 142 | % | | 50 | % | | 25 | % |
| |
(1)
| Mr. Stuart joined the Company in September 2016 in conjunction with the Merger as the president and chief operating officer and was not a participant in the APIP during 2013 through 2016. |
| |
(2)
| Based on the Company’s overall financial performance in 2014, the Compensation Committee elected to apply a discretionary 20% reduction in the dollar value of the amounts awarded under the APIP in 2014. This adjustment reduced the APIP award from 223% of salary to 179% for the CEO and from 178% of salary to 142% for the CFO. |
Table presented below.
Other Cash Bonuses
- The Company has rarely
Annual discretionary cash bonuses are paid a discretionary bonus to the most senior executivesNEOs not participating in the APIP and no discretionary cash bonuses were awarded to any participant for 2015, 2016 or 2017. The Compensation Committee does not intend to make discretionary payments to the CEO, COO or CFO in the future. Annual cash bonuses may be paid to certain other NEOs and otherkey employees to reflect the breadth of their expertise and responsibility, achievement of certain financial or strategic results and to make the cash component of compensation competitive with that of the Company’s peers. While the Company maintains broad discretion to vary overall cash compensation for a given year by varying the amount, if any, of such cash bonuses, these bonuses are typically determined by evaluating financial and strategic targets such as revenues, operating profits and margins and store additions, among other things. These cash bonuses may reflectcriteria, in a material partmanner similar to the NEOs participating in the APIP.
For 2020, the other NEO’s contributions to the achievement of the NEOs’ overall compensation, with payments commensurate withabove noted key resiliency factors were also taken into account when determining their cash bonus awards. Specifically, the executive’s position, responsibilitiesCEO and individualthe Compensation Committee determined the contributions of Mr. Ramos, as SVP of Latin American Operations, and overallMs. Alvarado, as General Counsel, were at an extraordinary level in their respective roles during the pandemic, which allowed the Company performance. Annualto continue operating its stores safely and effectively. In the case of Mr. Ramos, he provided invaluable leadership in directing operations for over 1,850 stores in four Latin American countries and south Texas, which were all disproportionately impacted by COVID-19, and in the case of Ms. Alvarado, by leading the Company’s efforts to continue operating and serving customers by obtaining essential service designations by government officials and regulators. Other key executives in addition to Mr. Ramos and Ms. Alvarado received discretionary cash bonusesawards, as well, for their contributions to the Company’s resiliency. However, given the impact of the pandemic on the financial results of the Company, the amount of the awards were capped at the levels paid in 2019. The resulting 2020 cash bonus awards of $750,000 to other NEOs areMr. Ramos and $440,000 to Ms. Alvarado were reviewed and approved by the Compensation Committee based on the CEO’s recommendation. Fiscal 2017 cash bonus awards to NEOs consisted of $625,000 to Mr. Ramos and $350,000 to Ms. Alvarado, which included certain extraordinary amounts related to the achievement of Merger-related performance objectives.
Long-Term Incentive Compensation
The compensation objective of retaining the best people for the job leads the Company to makemakes annual periodic equity awards to its NEOs and certain other employees. These awardsemployees to provide incentive for the NEOsthem to achieve targeted levels of financial performance and stay with the Company over the long term, andas well as align thetheir interests of the NEOs with those of the Company’s stockholders. These equity awards also provide additional flexibility to the Compensation Committee to reward superior performance by NEOs.
The Compensation Committee has established a Long-Term Incentive Plan (“LTIP”) forNEOs and certain NEOs. Performance-based restricted stock units granted under the LTIP vest over multi-year periods, contingent upon the Company attaining defined performance targets. The Compensation Committee certifies the attainmentother employees, generally in late January of the performance targets upon completion of the respective performance periods, and any earned shares are distributed to participants following the end of such performance periods. The grants have specific rules related to the treatment of the awards in the event of termination for cause, voluntary resignation, retirement, involuntary termination and change in control, which are described later under “Summary of Potential Payments Upon Termination or a Change in Control.” In addition, the Company grants time-based restricted stock units to certain executive officers and employees not participating in the LTIP.
each year. The date of grant for all equity awards granted to NEOs and employees is the date of Compensation Committee approval. The Company does not have a program, plan or practice of timing the grant of equity awards in coordination with the release of material non-public information. The Company believes all such equity grants as described herein align the executives’ interests with those of the Company’s stockholders.
While the use of equity awards is an important part of the Company’s overall executive compensation program, the Company is also aware of its responsibility to its shareholders to exercise judgement in the granting of such awards. As a result, the Company monitors its annual share usage, or “burn rate,” and the LTIP’s potential impact on its shareholders.
Restricted Stock Unit Award Enhancements for 2017
- In conjunction with the Merger, the Compensation Committee engaged Pay Governance to develop and propose modifications to
The annual share usage, or burn rate, under the LTIP under whichfor the Company makeslast three years was as follows:
| | | | | | | | | | | | | | | | | | | | | | | | | | | | | | | | |
| | 2020 | | | 2019 | | 2018 |
Total restricted stock units granted (annual share usage) (1) | | | 145,923 | | (2) | | | 128,381 | | | | 119,440 | |
| Weighted-average common shares outstanding | | | 41,502,000 | | | | | 43,020,000 | | | | 44,777,000 | |
| Annual share usage as percentage of shares outstanding (burn rate) | | 0.35 | % | | | 0.30 | % | | 0.27 | % |
(1)Assuming the performance goals with respect to performance-based grants of restricted stock units toare achieved at maximum levels.
(2)Excludes the January 2020 grant of performance based restricted stock units as they were cancelled and replaced in December 2020. See the “Long-Term Incentive Program” section below for further details.
Long-Term Incentive Program
The Compensation Committee has established an LTIP for the CEO, COO and CFO. Based on the recommendations of Pay Governance and the work of the Compensation Committee, the following changes were approved and implemented for 2017:
Established a three-year cumulative performance measurement period to replace prior years’ series of stacked one-year performance periods
Eliminated the duplicative adjusted EBITDA measure fromPerformance-based restricted stock units granted under the LTIP while retaining the measure in the APIP
Added a second discreet performance measure for the LTIP, total store additions, while eliminating it as a measure in the APIP
Provided for a range of outcomes in the 2017 LTIP grants (i.e., a performance range between defined threshold and maximum performance parameters) versus the prior year grant’s single point outcomes (i.e., either the target performance was met and payouts were made or target performance was not met and no payouts were made)
Used adjusted net income and total store additions as the performance measures for the 2017 LTIP grant, recognizing that cumulative net incometypically vest over a three-year period, would likely be closely followed by stockholderscontingent upon the Company attaining defined performance goals tied to earnings and have an impact on long-term stockholder returns, while growth in store locations would be a key driver of future long-term growth and profitability
The Compensation Committee also increased the target percentage of pay from long-term performance-based incentive awards (LTIP) while reducing the target percentage of pay from the annual performance incentive plan awards (APIP) for the CEO, COO and CFO positions. The Committee believes this change provides a greater focus on achievement of long-term performance results and executive retention and better matches management and stockholder interests.
2017 Restricted Stock Units Granted Under the LTIP - In fiscal 2017, performance-based restricted stock units were granted under the LTIP to the CEO, COO and CFO. The shares vest at the end of a three-year cumulative performance period beginning on January 1, 2017 and ending on December 31, 2019 (as opposed to previous years when such awards were vested annually based on attainment of discrete targets for each year).metrics. To determine the number of restricted stock unit awards that vest under the LTIP, the Compensation Committee measures the three-year cumulative performance of the Company at the end of the three-year performance period against a three-yearthe cumulative target prepared by management and reviewed andperformance goals approved by the BoardCompensation Committee typically in the first quarter of Directors at the beginning of the fiscal year of the initial grant. The Company’s level of achievement of the performance goals set forth in the three-year cumulative targetperformance period will result in the vesting of restricted stock unit awards between zero and 150% of a stated maximumtarget number of shares on December 31, 2019.shares. The performance goals are approved by the Compensation Committee and designed to reinforce the Company’s focus on profitability and enhancement of long-term stockholder value.value performance. The rangetarget number of percentagesshares for each participating executive officer areis based on the scope of the officer’s responsibilities, internal pay equity among participating executive officers with similar responsibilities and competitive considerations and are reviewed annually by the Compensation Committee.
2020 Performance-Based Restricted Stock Units Granted Under the LTIP
Original LTIP Award - In January 2020, performance-based restricted stock units were granted under the LTIP to the CEO, COO and CFO. The Compensation Committee established the following performance measures, weightings and cumulative performance periods for the January 2020 grant:
| | | | | | | | | | | | | | |
| Performance Measure | | Weight | | Cumulative Performance Period |
| Adjusted net income | | 40% | | January 1, 2020 - December 31, 2022 |
| Pawn revenue (on a constant currency basis) | | 40% | | January 1, 2020 - December 31, 2022 |
| New store openings | | 20% | | January 1, 2020 - December 31, 2022 |
The cumulative three-year performance goals established for adjusted net income and pawn revenue were established in January 2020 based on target adjusted net income and pawn revenue for 2020 (on a basis which was equivalent to the level of the target profitability metrics used in the APIP) with increases in 2021 and 2022 based on long-term growth rates established by the Compensation Committee. The cumulative three-year performance goal established for new store openings was based on the total store additions budgeted for 2020 with increases in 2021 and 2022 based on a long-term store growth rate established by the Compensation Committee.
The following table sets forth each participant’s threshold, target and maximum stock grant opportunities and the respective grant date fair value of the awards for each of the January 2020 LTIP performance measures:
| | | | | | | | | | | | | | | | | | | | | | | | | | | | | | | | | | | | | | | | | | | | | | | | | | | | | | | | |
| | | CEO | | | COO/CFO |
| | Threshold (1) | | Target | | Maximum | | Threshold (1) | | Target | | Maximum |
Considered Award Value (2): | | | | | | | | | | | | | | | | | | |
| Adjusted net income | | $ | 375,000 | | | $ | 1,500,000 | | | $ | 2,250,000 | | | $ | 125,000 | | | $ | 500,000 | | | $ | 750,000 | |
| Pawn revenue (constant currency) | | | 375,000 | | | | 1,500,000 | | | | 2,250,000 | | | | 125,000 | | | | 500,000 | | | | 750,000 | |
| New store openings | | | 187,500 | | | | 750,000 | | | | 1,125,000 | | | | 62,500 | | | | 250,000 | | | | 375,000 | |
| Total | | $ | 937,500 | | | $ | 3,750,000 | | | $ | 5,625,000 | | | $ | 312,500 | | | $ | 1,250,000 | | | $ | 1,875,000 | |
| | | | | | | | | | | | | | | | | | |
Award Shares Granted (3): | | | | | | | | | | | | | | | | | | |
| Adjusted net income | | | 4,577 | | | | 18,308 | | | | 27,462 | | | | 1,526 | | | | 6,103 | | | | 9,154 | |
| Pawn revenue (constant currency) | | | 4,577 | | | | 18,308 | | | | 27,462 | | | | 1,526 | | | | 6,103 | | | | 9,154 | |
| New store openings | | | 2,289 | | | | 9,155 | | | | 13,732 | | | | 762 | | | | 3,051 | | | | 4,577 | |
| Total | | | 11,443 | | | | 45,771 | | | | 68,656 | | | | 3,814 | | | | 15,257 | | | | 22,885 | |
| | | | | | | | | | | | | | | | | | |
Grant date fair value of award (4) | | $ | 971,854 | | | $ | 3,887,331 | | | $ | 5,830,954 | | | $ | 323,923 | | | $ | 1,295,777 | | | $ | 1,943,623 | |
(1) No award is earned if actual performance is less than the performance measure threshold amounts.
(2) The considered award values are amounts determined by the Compensation Committee in setting target compensation and are used to determine the award shares granted. These values do not represent the grant date fair value shown in the “Stock Awards” column of the Summary Compensation Table below.
(3) Award shares granted are determined by dividing the considered award values by the average of the closing price of the Company’s stock over the 45 trading days immediately prior to the grant date, which was $81.93 per share.
(4) The grant date fair value was determined by multiplying the number of award shares granted by the closing market price of $84.93 per share for the Company’s Common Stock on the date of the grant.
The significant impacts of COVID-19 on actual performance in 2020 and projected performance in 2021 caused the cumulative three-year threshold performance targets of the January 2020 grant to be deemed unattainable by the Compensation Committee in the second quarter of 2020. In evaluating alternatives to address the impact of the pandemic on these grants, the Compensation Committee considered the lost value to the Company’s executives resulting from the unattainable goals of the January 2020 grant, the expected substantially lower value of the 2019 LTIP grant that vests in February 2022 (see details below) and the lower value of the 2018 LTIP grant that vested in January 2021 (see details below), all of which were significantly impacted by COVID-19 because 2020 was included in each grant’s three-year performance period.
The Compensation Committee considers long-term equity compensation a key part of the Company’s compensation program to motivate its senior executives in creating long-term stockholder value and align their interests with those of the Company’s stockholders. In particular, the Compensation Committee is concerned about the diluted motivational value of the in-cycle awards and the potential risk associated with executives placing additional emphasis on shorter-term APIP outcomes in light of the reduced opportunity resulting from the pandemic’s impact on LTIP performance cycles.
After reviewing alternative approaches with Pay Governance, the Compensation Committee addressed the pandemic’s impact on LTIP awards by cancelling the January 2020 grant and replacing it with a new grant of performance-based awards in December 2020 with a reduced target award as described below. However, no changes were made to the 2018 or 2019 LTIP grants that were outstanding as of December 31, 2020.
LTIP Replacement Award - In December 2020, the Compensation Committee cancelled the original 2020 LTIP award and provided a replacement grant that remains 100% performance-based. The terms of the December 2020 replacement LTIP award includes the following provisions:
•Reduction in the considered award value of the target for the CEO to $3.1 million, compared to the original January 2020 target award of $3.8 million. For fiscal 2017,the COO and CFO, the considered value of the target award was reduced to $1.0 million, compared to $1.3 million for the January 2020 grant. The reductions in the considered value of the target awards were made because stockholders and other stakeholders were meaningfully impacted by the Company’s financial performance during 2020 and because the performance periods for the adjusted net income and total store additions performance measures were reduced from three years to two years.
•Addition of a new relative TSR performance measure in the LTIP replacement award to more closely align management’s interests with stockholders. The performance measure replaces the existing pawn revenue performance measure and extends the vesting measurement period for this element of the 2020 LTIP for a full three-year period (beginning on January 1, 2021 and extending to December 31, 2023). TSR performance will be measured against the Company’s compensation peer group.
•The performance period and cumulative target for the net income performance measure was modified to reflect the significant impact of COVID-19 on the business in 2020. The revised cumulative performance period is for the two-year period January 1, 2021 through December 31, 2022, with performance targets established by the Compensation Committee which reflect expected annual improvements over and above 2020 baseline performance.
•The performance target for store additions for the two-year period January 1, 2021 through December 31, 2022 remained consistent with targets for those years under the original award; however, the definition of store additions was expanded to include stores added through acquisitions and accretive relocations of existing stores, which more closely reflects the Company’s business strategy to grow earnings through a combination of new store openings, acquisitions and improving profitability of existing stores.
•Despite the negative impact of COVID-19 on actual performance in 2020 and projected performance in 2021, no replacement or modifications were made to the 2018 and 2019 LTIP awards.
Under the 2020 replacement awards, the Compensation Committee established performance goals that include adjusted net income targets and store addition targets as the following performance measures, weightings and cumulative performance periods for the LTIP (see the detailed reconciliation of non-GAAP financial measures in Appendix A). December 2020 replacement grant:
| | | | | | | | | | | | | | |
| Performance Measure | | Weight | | Cumulative Performance Period |
| Adjusted net income | | 33.3% | | January 1, 2021 - December 31, 2022 |
| Total store additions | | 33.3% | | January 1, 2021 - December 31, 2022 |
| Relative TSR | | 33.3% | | January 1, 2021 - December 31, 2023 |
The Compensation Committee believes adjusted net income, andtotal store additions and relative TSR provided under the 2020 replacement award are proper metrics to use for evaluating and rewarding long-term performance evaluation because cumulativein the context of an expected recovery from the impact of the COVID-19 pandemic during 2021-2023:
•By definition, the adjusted net income over a three-year period would likely be closely followed by stockholdersmeasure includes all normal and have an impact on long-term stockholder returns,recurring operating expenses, including financing costs, while excluding any potential benefit from share repurchases.
•The growth in store locations would befrom new openings, acquisitions and other accretive relocations is considered a key driver of future long-term revenue and profitability growth and profitability. Almost allas most of the Company’s customers access the Company’s products and services directly from neighborhood-based retail locations. Accordingly, store growth from both acquisitions and new store openings,additions is critical for accessing new customers in new and expanding markets.
•Relative TSR is tied directly to the Company’s future share price and dividend performance and management’s ability to create shareholder value going forward, further aligning the interests of management and the Company’s shareholders. The Compensation Committee believes this measure is appropriate given recent shareholder performance during the COVID-19 pandemic.
•The equal weighting of the three performance measures provides a balance between financial performance, long-term growth drivers and shareholder returns.
The following table sets forth each participant’s threshold, target and maximum payouts based onstock grant opportunities and the grant-daterespective grant date fair value of the awards available for each of the 2017December 2020 LTIP performance measures:
|
| | | | | | | | | | | | | | | | | | | | | | | | | | | | | | | | | | | | |
| | | Adjusted Net Income | | Store Additions | | Total |
| Participant | | Threshold | | Target | | Maximum | | Threshold | | Target | | Maximum | | Threshold | | Target | | Maximum |
| CEO | | $ | 214,423 |
| | $ | 857,740 |
| | $ | 1,286,683 |
| | $ | 321,683 |
| | $ | 1,286,683 |
| | $ | 1,930,000 |
| | $ | 214,423 |
| | $ | 2,144,423 |
| | $ | 3,216,683 |
|
| COO | | 96,500 |
| | 386,000 |
| | 482,500 |
| | 144,750 |
| | 579,000 |
| | 723,750 |
| | 96,500 |
| | 965,000 |
| | 1,206,250 |
|
| CFO | | 96,500 |
| | 386,000 |
| | 482,500 |
| | 144,750 |
| | 579,000 |
| | 723,750 |
| | 96,500 |
| | 965,000 |
| | 1,206,250 |
|
| | | | | | | | | | | | | | | | | | | | | | | | | | | | | | | | | | | | | | | | | | | | | | | | | | | | | | | | |
| | | CEO | | | COO/CFO |
| | Threshold (1) | | Target | | Maximum | | Threshold (1) | | Target | | Maximum |
Considered Award Value (2): | | | | | | | | | | | | | | | | | | |
| Adjusted net income | | $ | 260,417 | | | $ | 1,041,667 | | | $ | 1,562,500 | | | $ | 86,805 | | | $ | 347,222 | | | $ | 520,833 | |
| Total store additions | | | 260,417 | | | | 1,041,667 | | | | 1,562,500 | | | | 86,805 | | | | 347,222 | | | | 520,833 | |
| Relative TSR | | | 520,833 | | | | 1,041,666 | | | | 1,562,500 | | | | 173,612 | | | | 347,223 | | | | 520,835 | |
| Total | | $ | 1,041,667 | | | $ | 3,125,000 | | | $ | 4,687,500 | | | $ | 347,222 | | | $ | 1,041,667 | | | $ | 1,562,501 | |
| | | | | | | | | | | | | | | | | | |
Award Shares Granted (3): | | | | | | | | | | | | | | | | | | |
| Adjusted net income | | | 4,135 | | | | 16,540 | | | | 24,810 | | | | 1,378 | | | | 5,513 | | | | 8,270 | |
| Total store additions | | | 4,135 | | | | 16,540 | | | | 24,810 | | | | 1,378 | | | | 5,513 | | | | 8,270 | |
| Relative TSR | | | 8,270 | | | | 16,539 | | | | 24,809 | | | | 2,757 | | | | 5,514 | | | | 8,270 | |
| Total | | | 16,540 | | | | 49,619 | | | | 74,429 | | | | 5,513 | | | | 16,540 | | | | 24,810 | |
| | | | | | | | | | | | | | | | | | |
Grant date fair value of award (4) | | $ | 1,197,000 | | | $ | 3,590,927 | | | $ | 5,386,427 | | | $ | 398,976 | | | $ | 1,197,000 | | | $ | 1,795,500 | |
Adjusted Net Income Goals
(1) No award is earned if actual performance is less than the performance measure threshold amounts.
(2) - The performance target for adjusted net income is based on budgeted net income for 2017 with increases in fiscal 2018 and 2019 based on a long-term earnings growth formula established by the Compensation Committee. The Compensation Committee reviewed the net income target to ensure alignment in supporting the Company’s long-term internal targets for revenue and earnings per share growth, while also balancing the risk of over-incentivizing growth.
Store Addition Goals - The performance target for store openings is based on the store openings budgeted for 2017 with increases in fiscal 2018 and 2019 based on a long-term store growth formula established by the Compensation Committee. The Compensation Committee reviewed the store opening target to ensure alignment in supporting the Company’s long-term internal targets for revenue and earnings growth while also balancing the risk of over-incentivizing growth.
Pending acquisition activity is a consideration when setting cumulative store addition targets if such pending acquisitions have a high degree of certainty for closing. Over the past few years, the Company has targeted to add approximately 75 stores per year, net of pending acquisitions. While acquisitionsconsidered award values are included in the store additions, they typically decrease the number of de novo store openings during the integration period following an acquisition because of the increased effort required to staff and integrate the newly-acquired stores into the Company’s internal systems. When the cumulative targets for the 2017 award cycle were set by the Compensation Committee,
there were no considered pending acquisitions (unlike 2016 when the store additions target utilized for the APIP was 230 stores for a single year as there was a pending acquisition of 179 stores at the time the target was set at the beginning of 2016).
2016 LTIP Grant Vesting in 2017 - In fiscal 2016, the CEO was granted 30,000 shares and the CFO was granted 10,000 shares under the LTIP, which vest in four annual installments of 7,500 shares for the CEO and 2,500 shares for the CFO based on the attainment of an annual performance target of adjusted EBITDA. The adjusted EBITDA target for each of the annual vesting periods was setamounts determined by the Compensation Committee in early 2016, which wassetting target compensation and are used to determine the award shares granted. These values do not represent the grant date fair value shown in the “Stock Awards” column of the Summary Compensation Table below.
(3) Award shares granted are determined by dividing the considered award values by the average of the closing price of the Company’s stock over the 45 trading days immediately prior to the Merger. Actual fiscal 2017 adjusted EBITDAgrant date, which was $273 million compared to the fiscal 2017 target of $139 million and accordingly, 100% of the shares available for vesting in 2017 were awarded.$62.98 per share.
LTIP Historical Vesting(4) - The Compensation Committee believes the historical payout levels under the LTIP demonstrate an appropriate level of historical rigor in setting the long-term performance goals. The following table detailsgrant date fair value was determined by multiplying the number of award shares granted vestedby the closing market price of $72.37 per share for the Company’s Common Stock on the date of the grant.
Historical LTIP Grants and forfeited for all performance-based share awards granted to current participating NEOs (CEO,Performance:
2019 LTIP Grants - In 2019, the CEO, COO and CFO) overCFO were granted awards of performance-based restricted stock units under the past five years.LTIP. The Merger constituted2019 grant has a changethree-year cumulative performance period that began on January 1, 2019 and ends on December 31, 2021. These grants are more fully described in controlthe table of Outstanding Equity Awards as of December 31, 2020 provided later in this section. While the projected performance results for purposesthe 2019 LTIP grants have also been substantially impacted by COVID-19, with projected payouts now expected in a range of equity awards held by0% to 50% of the target award, the Compensation Committee elected not to adjust or modify these awards.
2018 LTIP Grants - In 2018, the CEO, COO and CFO were granted awards of performance-based restricted stock units under the LTIP. The 2018 grant had a three-year cumulative performance period that began on January 1, 2018 and theyended on December 31, 2020. The number of shares which vested in certain restricted shares granted prior to 2016 becauseon January 31, 2021 was based on the achievement of cumulative three-year performance goals for each performance measure. While the change in control. Beginning in 2016,actual three-year cumulative net income performance results for the 2018 LTIP grants included a double triggerwas substantially impacted by COVID-19, the Compensation Committee elected not to adjust or modify these awards. The Compensation Committee further believes the 2018 LTIP grant would have paid out at or near maximum had the COVID-19 pandemic not occurred in the event of a change in control, and shares associated with that grant did not vest because of the change in control:2020.
|
| | | | | | | | | | | | | | | | | | | | |
| Grant Year | | Aggregate Granted to CEO, COO and CFO | | Measure(s) | | Vesting Due To Performance | | Vesting Due To Merger | | Forfeited Due to Performance | | Remaining Unvested (Vesting Subject to Future Performance) |
| 2017 | | 84,444 |
| (1) | Adjusted Net Income &
Store Additions | | | — |
| | | — |
| | | — |
| | 84,444 |
|
| 2016 | | 40,000 |
| | Adjusted EBITDA | | | 20,000 |
| | | — |
| (2) | | — |
| | 20,000 |
|
| 2015 | | 40,000 |
| | Adjusted EBITDA | | | — |
| | | 30,000 |
| | | 10,000 |
| | — |
|
| 2014 | | 40,000 |
| | Adjusted EBITDA | | | — |
| | | 20,000 |
| | | 20,000 |
| | — |
|
| 2013 | | 40,000 |
| | Adjusted EPS | | | 10,000 |
| | | 10,000 |
| | | 20,000 |
| | — |
|
| 2012 | | 40,000 |
| | Adjusted Net Income | | | 20,000 |
| | | — |
| | | 20,000 |
| | — |
|
| Total | | 284,444 |
| | | |
| 50,000 |
| |
| 60,000 |
| |
| 70,000 |
| | 104,444 |
|
| Percent of shares vested and forfeited based on attainment of performance measures | | 28 | % | | 33 | % | | 39 | % | | |
| | | | | | | | |
| Amount represents the number of shares that would vest based on the target award. If the performance measures for the 2017 performance grants resulted in a maximum grant upon completion of the vesting period, 116,667 shares would vest. |
| |
(2)
| The 2016 awards were the first awards to include a double-trigger change in control provision and, accordingly, the shares did not vest as a result of the Merger. All subsequent grants in 2017 and later will also have a double trigger. |
The following table sets forth the three-year cumulative performance goals for each of the performance measures of the 2018 grant and the actual three-year cumulative performance achieved (dollars in thousands):
| | | | | | | | | | | | | | | | | | | | | | | | | | | | | | | | | | | | | | | | | | | | | | | | | | |
| | | | Cumulative Performance Goals | | Cumulative
Actual Performance | | Payout as a % of Target Shares |
| 2018 Grant Performance Measure | | Weight | | Threshold | | Target (2) | | Maximum | | |
Adjusted net income (1) | | 40 | % | | $ | 352,292 | | | $ | 414,461 | | | $ | 455,907 | | | $ | 424,054 | | | 111 | % |
| Total store additions | | 60 | % | | | 242 | | | | 285 | | | | 314 | | | | 866 | | | 150 | % |
| Weighted Total Payout | | | | | | | | | | | | | | | | 134 | % |
2017
(1) The adjusted net income performance measure for the 2018 grant is defined as adjusted net income as calculated in the Company’s SEC filings further adjusted to exclude net income derived from non-core consumer lending operations, which was discontinued in June of 2020. Both the cumulative performance goals and actual performance exclude net income derived from such operations.
(2) The target three-year cumulative performance goal for adjusted net income and total store additions represented a 13% and 4% three-year compound annual growth rate, respectively.
The following table sets forth each participant’s threshold, target and maximum stock grant opportunities for the 2018 grant based on the achievement of the three-year cumulative performance goals and the actual number of shares that vested on January 31, 2021 based on the actual three-year cumulative performance:
| | | | | | | | | | | | | | | | | | | | | | | | | | | | | | | | |
| | | | | | Shares Awarded Based on Actual Three-Year Cumulative Performance |
| | Potential Share Award | | Payout as a % of Target Shares | |
| NEO | | Threshold | | Target | | Maximum | | |
| Rick L. Wessel, CEO | | 4,000 | | | 40,000 | | | 60,000 | | | 134 | % | | 53,760 | |
| T. Brent Stuart, COO | | 1,400 | | | 14,000 | | | 21,000 | | | 134 | % | | 18,816 | |
| R. Douglas Orr, CFO | | 1,400 | | | 14,000 | | | 21,000 | | | 134 | % | | 18,816 | |
Other Restricted Stock Unit Awards
-
During fiscal 2017,January 2020, prior to the onset of the pandemic, the Company also granted a total of 3,00010,000 shares of time-based restricted stock units to two of the NEOs of the Company (Mr. Ramos and Ms. Alvarado). While the Company maintains broad discretion over time-based grants, these grants are typically determined by evaluating financial and strategic targets such as revenues, operating profits and margins and store additions among other things, with grants commensurate with the NEO’s position, responsibilities and individual and overall Company performance. These time-based awards vest ratably over timein five equal annual installments beginning in February 2018,2021 and become fully vested in February 2022.2025. The grants have specific rules relatedawards were not adjusted due to the treatmentCOVID-19 pandemic given their time-based nature.
Alignment of Pay and Performance
The Compensation Committee considers the realized and realizable value of the Company’s compensation plans in relation to the Company’s performance and that of its peer group. The figure below compares the CEO’s compensation per the summary compensation table, which reflects the accounting value of long-term incentives at grant date and not the value actually received from these grants or their potential future value, to the CEO’s realized compensation for 2017 and 2018, which is the amount the CEO actually received including vested LTIP awards granted in each respective year and an estimate of realizable compensation for 2019 and 2020, which represents the CEO’s future pay opportunity for each year including unvested LTIP awards granted in each respective year valued as of December 31, 2020. The chart also illustrates how the Company’s TSR (consisting of stock price appreciation/depreciation and dividends paid during the period) has compared to the TSR of the companies in the eventCompany’s compensation peer group over the four-year period presented. The Company believes this comparison illustrates the important role that “at risk” performance-based compensation plays in linking the value of terminationcompensation actually received by the CEO to the various performance measures used by the Company’s programs and to the Company’s TSR.
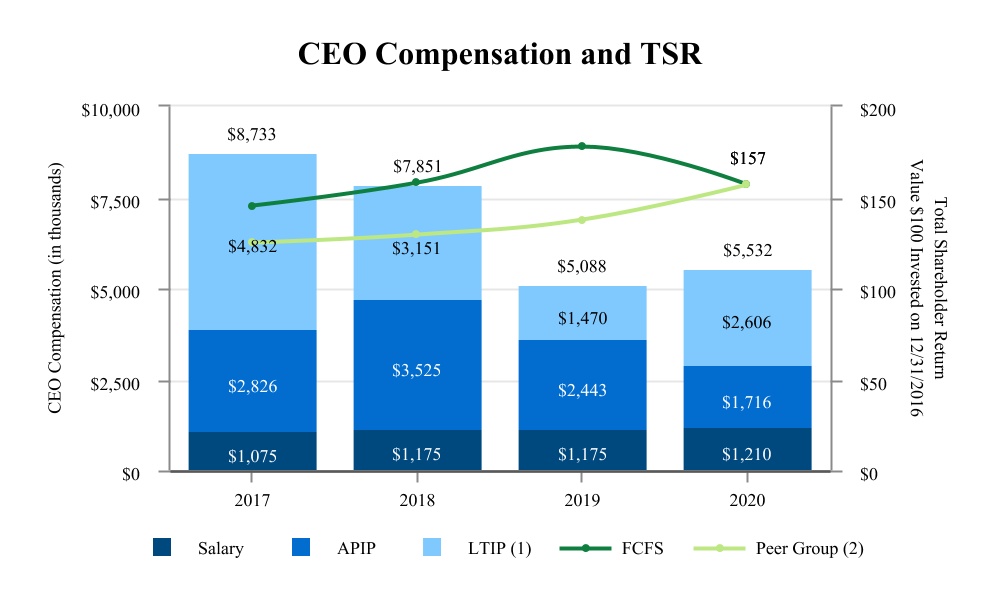
(1) For 2019 and 2020, represents the projected value realizable upon vesting (using the December 31, 2020 stock price) of the 2019 LTIP award (for the three year performance period from 2019 to 2021), which is estimated to pay out at approximately 50% of target, and the projected value realizable upon vesting (using the December 31, 2020 stock price) of the replacement 2020 LTIP award (for the three year performance period from 2021 to 2023), which is estimated to pay out at approximately 75% of target.
(2) Peer Group TSR is calculated assuming an equal beginning investment in each company included in the 2020 Peer Group.
Compensation Plan Actions for cause, voluntary resignation, retirement, involuntary termination2021
The Committee made no changes to salaries or APIP opportunities for the CEO, COO and changeCFO for 2021 and made minor adjustments to the value of the 2021-2023 LTIP grants for the three senior executives in control.the context of the ongoing COVID-19 pandemic. The other named NEO’s received nominal cost of living adjustments to their salaries with no expected increase in the range of their bonus opportunity or restricted stock awards.
As a result of the continued efforts to improve its pay practices, the Company has made certain changes in its compensation programs and practices beginning in 2021. Based on recommendations by Pay Governance and the Compensation Committee, the following changes were approved and implemented for the executive compensation plans in 2021:
•The modified performance measures and weightings for both the 2021 APIP and 2021-2023 LTIP include a relative performance measure using TSR for the one- and three-year performance periods, respectively.
•Based on the result of benchmarking its compensation plans to its peer group, the Company added a time-vested element to its LTIP. The 2021-2023 LTIP remains 75% performance-based.
The Compensation Committee established the following performance measures and weightings for the 2021 APIP:
| | | | | | | | |
| Performance Measure | | Weight |
| Adjusted diluted earnings per share | | 25% |
| Adjusted EBITDA | | 25% |
| Net revenue (gross profit) | | 25% |
| 1-year relative TSR vs. compensation peers | | 25% |
The Compensation Committee established the following performance measures, weightings and cumulative performance periods for the 2021-2023 LTIP:
| | | | | | | | | | | | | | |
| Performance Measure | | Weight | | Cumulative Performance Period |
| Adjusted net income | | 25% | | January 1, 2021 - December 31, 2023 |
| Total store additions | | 25% | | January 1, 2021 - December 31, 2023 |
| 3-year relative TSR vs. compensation peers | | 25% | | January 1, 2021 - December 31, 2023 |
| Time vested award (three year cliff vesting) | | 25% | | Vesting Date - December 31, 2023 |
Perquisites and Personal Benefits
CertainThe NEOs received additional remuneration consistent with the Company’s approach to hiring and retaining key personnel. Such perquisites includepersonnel, such as benefits provided to all full-time employees, including matching contributions to 401(k) accounts, health insurance, life insurance and disability insurance,insurance. Certain NEOs received perquisites, such as automobile allowances, club memberships, and certainfor the CEO, opportunities to travel using the Company’s aircraft.
The Company does not provide supplemental non-qualified retirement or deferred compensation plans to any of its executives. executives and no executive, other than the CEO, received more than $10,000 in perquisites and personal benefits.
The aggregate incremental cost to the Company during fiscal 20172020 of such benefits is reflected in the Summary Compensation Table below.
Anti-Hedging Policy
The Company’s insider trading policy prohibits all of its directors, officers and employees from engaging in “short sales” or “sales against the box” or trading in puts, calls, warrants or other derivative instruments on the Company’s securities. The Board of Directors believes this prohibition further aligns the interests of directors and executives with those of stockholders, facilitates compliance with insider-trading and other applicable laws, and aids in preventing directors and executives from subjecting themselves to an actual or potential conflict of interest with the Company or creating the appearance of such a conflict.
Executive Stock Ownership and Retention Guidelines
The Company’s Board of Directors has adopted stock ownership guidelines pursuant to which all NEOs are expected to own shares of Company stock, or hold unvested time-based restricted stock awards, equal in valuetotal to a multiple of the NEO’s salary, as follows:
| | | | | | | | | | | | | | | | | | | | | | | | | | |
| Participant | | Target Multiple | | Current Multiple as of
April 12, 2021 |
| Rick L. Wessel, CEO | | | 5 | x | Salary | | | 46.0 | x | Salary |
| T. Brent Stuart, COO | | | 3 | x | Salary | | | 4.4 | x | Salary |
| R. Douglas Orr, CFO | | | 3 | x | Salary | | | 15.5 | x | Salary |
| Raul R. Ramos, SVP Latin American Operations | | | 1 | x | Salary | | | 2.5 | x | Salary |
| Anna M. Alvarado, General Counsel | | | 1 | x | Salary | | | 2.6 | x | Salary |
|
| | | | | | | |
Participant | | Target Multiple | | Current Multiple as of
April 13, 2018
|
Rick L. Wessel, CEO | | 5x Salary | | 67.1x Salary |
T. Brent Stuart, COO | | 3x Salary | | 1.0x Salary |
R. Douglas Orr, CFO | | 3x Salary | | 19.3x Salary |
Raul R. Ramos, SVP Latin American Operations | | 1x Salary | | 3.1x Salary |
Anna M. Alvarado, General Counsel | | 1x Salary | | 0.2x Salary |
Until an executive has satisfied the stock ownership guidelines, they are required to retain 75% of the after-tax shares received upon the exercise or vesting of equity incentive awards. Furthermore, any sales of Company stock by an executive will be permitted only to the extent the executive will continue to meet the guidelines immediately following such sale. NEOs have five years after they first become eligible for the executive stock ownership guidelines to achieve the target multiple. Those NEOs above who have not yet achieved their respective target multiples are still within the five-year period.
Clawback Policy
The Company’s Board of Directors has adopted an executive compensation recovery, or “clawback,” policy that applies to all NEOs in the event the Company is required to restate its financial statements. The Compensation Committee may seek recovery of any short- or long-term incentive payment or award granted to executive officers during the three years preceding such restatement where (1)(i) the payment or award grant was calculated based on achievement of the misstated financial results; (2)(ii) the Board of Directors determines the executive engaged in intentional misconduct that materially contributed to the need for the restatement; and (3)(iii) a lower payment or award grant would have been made to the executive based upon the restated financial results.
In addition, if the Company is required, as a result of misconduct, to restate its financial results due to its material noncompliance with any financial reporting requirements under the federal securities laws, its CEO and CFO may be legally required to reimburse the Company for any bonus or other incentive-based compensation they received pursuant to the provisions of Section 304 of the Sarbanes-Oxley Act of 2002.
Tax and Accounting Considerations
The Company considers accounting and tax implications when designing its executive compensation and incentive programs. For example, the Compensation Committee has carefully considered the implications of Section 162(m) of the Code, and believes tax deductibility of compensation is an important consideration. Section 162(m) of theInternal Revenue Code generally disallows a tax deduction to public corporations for compensation greater than $1 million paid for any fiscal year to the chief executive officer or chief financial officer (at any time during the year), and eachthe three other most highly compensated executive officers (as of the next three highest compensated officers serving at the end of the taxable year other than the chief financial officer. However, priorany year). Prior to the enactment of the Tax Cuts and Jobs Act (“Tax Act”) in December 2017, certain types of performance-based compensation were excluded from the $1 million deduction limit if specific requirements were met. Under the Tax Act, this special exclusion for performance-based compensation was eliminated with respect to taxable years beginning after December 31, 2017 with certain limited grandfathered exceptions. In addition, the Tax Act expanded Section 162(m) of the Code to cover additional executive officers, including the chief financial officer, so that the compensation of individuals serving as the chief executive officer or chief financial officer (at any time during the fiscal year), and the three other most highly compensated executive officers (as of the end of any fiscal year) will be subject to Section 162(m) of the Code. Any executive officer whose compensation is subject to Section 162(m) of the Code in taxable years beginning after December 31, 2016 will have compensation subject to Section 162(m) of the Code for all future years whether or not they appear in any future proxy statements as
NEOs. As a result of the enactment of the Tax Act, compensation to certain NEOs in excess of $1 million will generally not be tax deductible beginning with the fiscal year ending December 31, 2018.
The Compensation Committee, where possible and considered appropriate, strives to preserve corporate tax deductions, including the deductibility of compensation to NEOs, although tax deductibility is not the primary factor used by the Compensation Committee in setting compensation and will become less of a factor used by the Compensation Committee followingconsidering the effective date of the changes made to Section 162(m) of the Code as provided in the Tax Act. The Compensation Committee also reserves flexibility where it is deemed necessary and in the best interests of the Company and its stockholders to continue to attract and retain the best possible executive talent, to approve compensation arrangements that are not necessarily fully tax deductible to the Company. While the Compensation Committee expects it will provide for compensation that will not be deductible under Section 162(m) of the Code, it will continue to structure the executive compensation program so that a significant portion of total executive compensation is linked to the performance of the Company.
Compensation Committee Report
The Compensation Committee of the Company has reviewed and discussed the “Compensation Discussion and Analysis” set forth above with management and, based on such review and discussions, the Compensation Committee recommended to the Board of Directors that the “Compensation Discussion and Analysis” be included in this Proxy Statement and incorporated by reference into the Company’s Annual Report on Form 10-K.
Members of the Compensation Committee:
Randel G. OwenJames H. Graves
Daniel E. Berce
Mikel D. Faulkner
James H. Graves
The Compensation Committee report above does not constitute “soliciting material” and will not be deemed “filed” or incorporated by reference into any of the Company’s filings under the Securities Act or the Exchange Act, except to the extent that the Company specifically incorporates it by reference herein.
Summary Compensation Table
The following table below summarizes the total compensation paid or earned by the 20172020 NEOs for the fiscal years ended December 31, 2017, 20162020, 2019 and 2015.2018. The stock awards and total compensation presented for 2020 for Messrs. Wessel, Stuart and Orr include the sum of a performance-based award grant in January 2020, which was subsequently cancelled in December 2020, plus a smaller replacement performance-based award granted in December 2020. Excluding the cancelled January 2020 award, the 2020 stock awards for Messrs. Wessel, Stuart and Orr were $3,590,927, $1,197,000 and $1,197,000, respectively. Proforma total 2020 compensation for these individuals excluding the cancelled awards are presented in a footnote to the Summary Compensation Table.
| | | | | | | | | | | | | | | | | | | | | | | | | | | | | | | | | | | | | | | | | | | | |
| | | | | | | | | | Non- | | | | |
| | | | | | | | | | Equity | | | | |
| | | | | | | | | | Incentive | | | | |
| | | | | | | | | | Plan | | All Other | | |
| Name and | | | | | | | | Stock | | Compen- | | Compen- | | |
| Principal | | | | Salary | | Bonus | | Awards | | sation | | sation | | Total |
| Position | | Year | | $ | | $ | | $ (2) | | $ (4) | | $ (5) | | $ |
| Rick L. Wessel, | | 2020 | | 1,210,250 | | | 1,715,529 | | (1) | 7,478,258 | | (3) | — | | | 84,566 | | | 10,488,603 | |
| Vice-Chairman, Chief | | 2019 | | 1,175,000 | | | — | | | 3,647,252 | | | 2,443,256 | | | 164,213 | | | 7,429,721 | |
| Executive Officer | | 2018 | | 1,175,000 | | | — | | | 2,926,000 | | | 3,525,000 | | | 178,440 | | | 7,804,440 | |
| | | | | | | | | | | | | | |
| T. Brent Stuart, | | 2020 | | 746,750 | | | 882,098 | | (1) | 2,492,777 | | (3) | — | | | — | | | 4,121,625 | |
| President, Chief Operating | | 2019 | | 725,000 | | | — | | | 1,326,266 | | | 1,116,271 | | | — | | | 3,167,537 | |
| Officer | | 2018 | | 725,000 | | | — | | | 1,024,100 | | | 1,450,000 | | | — | | | 3,199,100 | |
| | | | | | | | | | | | | | |
| R. Douglas Orr, | | 2020 | | 695,250 | | | 821,264 | | (1) | 2,492,777 | | (3) | — | | | — | | | 4,009,291 | |
| EVP, Chief Financial | | 2019 | | 675,000 | | | — | | | 1,326,266 | | | 1,047,386 | | | — | | | 3,048,652 | |
| Officer, Secretary, | | 2018 | | 675,000 | | | — | | | 1,024,100 | | | 1,350,000 | | | — | | | 3,049,100 | |
| Treasurer | | | | | | | | | | | | | | |
| | | | | | | | | | | | | | |
| Raul R. Ramos, | | 2020 | | 454,230 | | | 750,000 | | | 339,720 | | | — | | | — | | | 1,543,950 | |
| SVP Latin American | | 2019 | | 441,000 | | | 750,000 | | | 260,580 | | | — | | | — | | | 1,451,580 | |
| Operations | | 2018 | | 420,000 | | | 800,000 | | | 73,150 | | | — | | | — | | | 1,293,150 | |
| | | | | | | | | | | | | | |
| Anna M. Alvarado | | 2020 | | 540,750 | | | 440,000 | | | 509,580 | | | — | | | — | | | 1,490,330 | |
| General Counsel | | 2019 | | 525,000 | | | 440,000 | | | 347,440 | | | — | | | — | | | 1,312,440 | |
| | 2018 | | 500,000 | | | 400,000 | | | 219,450 | | | — | | | — | | | 1,119,450 | |
(1)Amounts represent cash incentive awards earned in consideration of actions taken by management to enable the Company to weather the significant disruption and uncertainty caused by COVID-19 (including safeguarding the health and safety of the Company’s employees and customers) and position the Company for success as economic conditions improve upon the end of the pandemic. The award was based on the results of an objective resiliency scorecard completed by members of the Board of Directors as more fully described in the “Short-Term Incentive Compensation” section of the “Compensation Discussion and Analysis.” The Compensation Committee utilized its discretion to modify the performance criteria of the original 2020 APIP award, which the Company failed to achieve threshold performance levels for the year under all three performance measures. Therefore, under SEC rules, this cash incentive award is classified as a “Bonus” rather than “Non-Equity Incentive Plan Compensation.”
(2)Amounts represent the grant date fair value determined in accordance with FASB ASC Topic 718 of restricted stock unit awards granted under the terms of the Company’s LTIP, which are described in the “Long-Term Incentive Compensation” section of the “Compensation Discussion and Analysis” above. The grant date fair value was determined by multiplying the number of restricted stock units (or, in the case of performance-based awards issued to the CEO, COO and CFO, the number of shares that would be issued based upon achievement of the target award) by the closing market price of the Company’s Common Stock on the date of the grant.
|
| | | | | | | | | | | | | | | | | | | | |
| | | | | | | | | | | Non- | | | | |
| | | | | | | | | | | Equity | | | | |
| | | | | | | | | | | Incentive | | | | |
| | | | | | | | | | | Plan | | All Other | | |
| Name and | | | | | | | | Stock | | Compen- | | Compen- | | |
| Principal | | | | Salary | | Bonus | | Awards | | sation | | sation | | Total |
| Position | | Year | | $ | | $ | | $ (1) | | $ (2) | | (3) | | $ |
| Rick L. Wessel, | | 2017 | | 1,075,000 |
| | — |
| | 2,144,423 |
| | 2,825,945 |
| | 126,631 |
| | 6,171,999 |
|
| Vice-Chairman, Chief | | 2016 | | 1,050,000 |
| | — |
| | 1,378,000 |
| | 3,675,000 |
| | 103,210 |
| | 6,206,210 |
|
| Executive Officer | | 2015 | | 1,021,760 |
| | — |
| | 1,404,300 |
| | 1,021,760 |
| | 79,594 |
| | 3,527,414 |
|
| | | | | | | | | | | | | | | |
| T. Brent Stuart, | | 2017 | | 700,000 |
| | — |
| | 965,000 |
| | 1,270,075 |
| | — |
| | 2,935,075 |
|
| President, Chief Operating | | 2016 | | 183,000 |
| | — |
| | — |
| | — |
| | 12,182 |
| | 195,182 |
|
Officer (4) | | | | | | | | | | | | | |
|
|
| | | | | | | | | | | | | | | |
| R. Douglas Orr, | | 2017 | | 650,000 |
| | — |
| | 965,000 |
| | 1,179,356 |
| | — |
| | 2,794,356 |
|
| EVP, Chief Financial | | 2016 | | 500,000 |
| | — |
| | 459,000 |
| | 1,250,000 |
| | — |
| | 2,209,000 |
|
| Officer, Secretary, Treasurer | | 2015 | | 487,190 |
| | — |
| | 468,100 |
| | 487,190 |
| | — |
| | 1,442,480 |
|
| | | | | | | | | | | | | | | |
| Raul R. Ramos, | | 2017 | | 400,000 |
| | 625,000 |
| | 44,250 |
| | — |
| | — |
| | 1,069,250 |
|
| SVP Latin American | | 2016 | | 355,000 |
| | 550,000 |
| | — |
| | — |
| | — |
| | 905,000 |
|
| Operations | | 2015 | | 345,000 |
| | 425,000 |
| | — |
| | — |
| | — |
| | 770,000 |
|
| | | | | | | | | | | | | | | |
| Anna M. Alvarado | | 2017 | | 450,000 |
| | 350,000 |
| | 88,500 |
| | — |
| | — |
| | 888,500 |
|
| General Counsel | | | |
|
| |
|
| |
|
| |
|
| |
|
| |
|
|
| | | | | | | | |
| Amounts represent the aggregate grant date fair value determined in accordance with FASB ASC Topic 718 of restricted stock awards granted under the terms of the Company’s LTIP, which are described in the “Long-Term Incentive Compensation” section of the “Compensation Discussion and Analysis” above. For performance-based awards issued to the CEO, COO and CFO, the grant date fair value was determined by multiplying the number of shares that would be issued based upon achievement of the target award by the closing market price of the Company’s common stock on the date of the grant. Assuming the performance measures for the 2017 performance grants would be achieved at maximum levels, the grant date fair value of the awards would be $3,216,683 for the CEO and $1,206,250 for the COO and CFO |
(3)Amount presented represents the sum of an award granted in January 2020, which was subsequently cancelled, and a replacement award granted in December 2020. In accordance with SEC guidance, amounts shown in this table include the grant date fair value of both awards, even though the January 2020 award was subsequently cancelled in 2020 and the NEOs did not receive any value from such awards. In January 2020, performance-based restricted stock units were granted under the LTIP to the CEO, COO and CFO, which had a grant date fair value of $3,887,331 for the CEO and $1,295,777 for the COO and CFO, based upon the achievement of the target award. In December 2020, the Compensation Committee elected to cancel the January 2020 awards. In December 2020, performance-based restricted stock units were granted under the LTIP to the CEO, COO and CFO to replace the cancelled January 2020 award, which had a grant date fair value of $3,590,927 for the CEO and $1,197,000 for the COO and CFO, based upon the achievement of the target award. Assuming the performance measures for the December 2020 performance grants would be achieved at maximum levels, the grant date fair value of the December 2020 awards would be $5,386,427 for the CEO and $1,795,500 for the COO and CFO. See the “Long-Term Incentive Compensation” section of the “Compensation Discussion and Analysis” above for further details.
(4)Amounts represent cash incentive awards earned under the terms of the Company’s APIP. The APIP provides for the payment of annual cash incentive compensation based upon the achievement of performance goals established annually by the Compensation Committee based on one or more specified performance criteria. The significant impact of COVID-19 on the Company’s business resulted in the Company failing to achieve threshold performance levels under the original 2020 APIP award. See the “Short-Term Incentive Compensation” section of the “Compensation Discussion and Analysis” above for further details.
(5)The Company provides the NEOs with certain group life, health, medical, and other noncash benefits generally available to all salaried employees that are not included in this column pursuant to SEC rules. As permitted by SEC rules, no amounts are shown in this table for perquisites and personal benefits for any individual NEOs for whom such amounts do not exceed $10,000 in the aggregate.
Amounts represent cash incentive awards earned under the terms of the Company’s APIP. The APIP provides for the payment of annual cash incentive compensation based upon the achievement of performance goals established annually by the Compensation Committee based on one or more specified performance criteria, as more fully described in the “Compensation Discussion and Analysis” above. |
| |
(3)
| The Company provides the NEOs with certain group life, health, medical, and other noncash benefits generally available to all salaried employees that are not included in this column pursuant to SEC rules. As permitted by SEC rules, no amounts are shown in this table for perquisites and personal benefits for any individual NEOs for whom such amounts do not exceed $10,000 in the aggregate. |
Mr. Wessel’s all other compensation for 20172020 includes matching contributions under the First Cash 401(k) Profit Sharing Plan of $6,875,$7,125, an automobile allowance of $6,437,$16,789, reimbursement for dues at a country club in the amount of $20,351,$22,733, Company-paid health insurance premiums in the amount of $5,466,$8,329, allowance for tax preparation fees of $3,000 and personal use of the corporate aircraft of $84,502.$26,590. The incremental cost of the personal use of the corporate aircraft was determined on a per flight and/or hours used basis based on variable costs associated with personal flight activity. The variable costs used in the calculation included fuel, crew compensation and travel, certain maintenance and repair expenses, related unoccupied positioning, or “deadhead,” flights, landing/parking and supplies.
Proforma 2020 Compensation
The following table summarizes the total compensation paid or earned by the CEO, COO and CFO for the year ended December 31, 2020 excluding the performance-based award grant in January 2020, which was subsequently cancelled in December 2020 and replaced with a smaller performance-based award granted in December 2020.
| | | | | | | | | | | | | | | | | | | | | | | | | | | | | | | | | | | | | | | | | | | | |
| | | | | | | | | | Non- | | | | |
| | | | | | | | | | Equity | | | | |
| | | | | | | | | | Incentive | | | | |
| | | | | | | | | | Plan | | All Other | | |
| Name and | | | | | | | | Stock | | Compen- | | Compen- | | |
| Principal | | | | Salary | | Bonus | | Awards | | sation | | sation | | Total |
| Position | | Year | | $ | | $ | | $ | | $ | | $ | | $ |
| Rick L. Wessel | | 2020 | | 1,210,250 | | | 1,715,529 | | | 3,590,927 | | | — | | | 84,566 | | | 6,601,272 | |
| T. Brent Stuart | | 2020 | | 746,750 | | | 882,098 | | | 1,197,000 | | | — | | | — | | | 2,825,848 | |
| R. Douglas Orr | | 2020 | | 695,250 | | | 821,264 | | | 1,197,000 | | | — | | | — | | | 2,713,514 | |
| | | | | | | | |
| Mr. Stuart joined the Company in September 2016 in conjunction with the Merger as the president and chief operating officer. Prior to that, Mr. Stuart served as Cash America’s president and chief executive officer. While employed with Cash America during the period from January 1 through August 31, 2016, Mr. Stuart earned a salary of $367,000, a performance-based short-term incentive award of $1,100,000 under the terms of Cash America’s short-term incentive plan (based on the achievement of certain financial objectives of Cash America through the date of the Merger) and primarily performance-based restricted stock awards granted under the terms of Cash America’s long-term incentive plan with an aggregate grant date fair value, determined in accordance with FASB ASC Topic 718, of $826,246 (based on the targeted attainment metrics of the performance-based awards). For a description of Cash America’s short- and long-term incentive plans, see Cash America’s proxy statement on Schedule 14A filed with the SEC on April 7, 2016. | |
Grants of Plan-Based Awards for Fiscal Year 20172020
The following table provides information regarding individual grants of plan-based awards to the NEOs during 2017.2020. As further described in the footnote below, the January 28, 2020 equity incentive plan awards for Messrs. Wessel, Stuart and Orr were subsequently cancelled in 2020 and no shares will vest or be paid out under these awards. Except as set forth below, there were no other grants of equity or non-equity awards to NEOs during 2017.2020.
| | | | | | | | | | | | | | | | | | | | | | | | | | | | | | | | | | | | | | | | | | | | | | | | | | | | | | | | | | | | |
| Name | | Grant
Date | | Estimated Future Payouts Under Non- Equity Incentive Plan Awards (1) | | Estimated Future Payouts
Under Equity Incentive Plan
Awards | | All Other Stock Awards: Number of Shares of Stock or Units (4) (#) | | | | | | Grant Date Fair Value of Stock and Option Awards (5) $ |
| | Thresh-
old
($) | | Target
($) | | Maximum
($) | | Thresh-
old
(#) | | Target
(#) | | Maximum
(#) | | | | |
| Wessel | | — | | 60,513 | | | 1,815,375 | | | 3,630,750 | | | — | | — | | — | | — | | | | | | — |
| | Jan 28, 2020 | (2) | — | | — | | — | | 2,289 | | | 45,771 | | | 68,656 | | | — | | | | | | 3,887,331 |
| | Dec. 18, 2020 | (3) | — | | — | | — | | 4,135 | | | 49,619 | | | 74,429 | | | — | | | | | | 3,590,927 |
| | | | | | | | | | | | | | | | | | | | | | |
| Stuart | | | | 37,338 | | | 933,438 | | | 1,493,500 | | | — | | — | | — | | — | | | | | | — |
| | Jan 28, 2020 | (2) | — | | — | | — | | 762 | | | 15,257 | | | 22,885 | | | — | | | | | | 1,295,777 |
| | Dec. 18, 2020 | (3) | — | | — | | — | | 1,378 | | | 16,540 | | | 24,810 | | | — | | | | | | 1,197,000 |
| | | | | | | | | | | | | | | | | | | | | | |
| Orr | | — | | 34,763 | | | 869,063 | | | 1,390,500 | | | — | | — | | — | | — | | | | | | — |
| | Jan 28, 2020 | (2) | — | | — | | — | | 762 | | | 15,257 | | | 22,885 | | | — | | | | | | 1,295,777 |
| | Dec. 18, 2020 | (3) | — | | — | | — | | 1,378 | | | 16,540 | | | 24,810 | | | — | | | | | | 1,197,000 |
| | | | | | | | | | | | | | | | | | | | | | |
| Ramos | | Jan 28, 2020 | | — | | — | | — | | — | | — | | — | | 4,000 | | | | | | | 339,720 | |
| | | | | | | | | | | | | | | | | | | | | | |
| Alvarado | | Jan 28, 2020 | | — | | — | | — | | — | | — | | — | | 6,000 | | | | | | | 509,580 | |
(1)Amounts represent threshold, target and maximum potential payouts under the terms of the APIP, which is described in the “Short-Term Incentive Compensation” section of the “Compensation Discussion and Analysis” above. For 2020, the Compensation Committee used their discretion in awarding amounts under the APIP based on management’s significant contributions under a wide range of key resilience factors. The actual payouts awarded under the terms of APIP were $1,715,529, $882,098 and $821,264 to Messrs. Wessel, Stuart and Orr, respectively, and such amounts are reflected in the “Bonus” column of the “Summary Compensation Table” above.
(2)Reflects shares granted January 28, 2020 under the LTIP, which is described in the “Long-Term Incentive Compensation” section of the “Compensation Discussion and Analysis” above. Given the unforeseen impact of COVID-19 after the awards were granted, these awards were subsequently cancelled and no shares will vest or be paid out under this award.
(3)Reflects shares granted December 18, 2020 under the LTIP, which is described in the “Long-Term Incentive Compensation” section of the “Compensation Discussion and Analysis” above. Two-thirds of the awards vest on December 31, 2022 and have a two-year cumulative performance period beginning on January 1, 2021 and ending on December 31, 2022 and therefore, none of the awards have vested. The remaining one-third of the awards vest on December 31, 2023 and have a three-year cumulative performance period beginning on January 1, 2021 and ending on December 31, 2023 and therefore, none of the awards have vested.
(4)The awards for Mr. Ramos and Ms. Alvarado vest in five equal annual installments beginning in February 2021 and become fully vested in February 2025.
(5)Amount represents the grant date fair value based on the number of shares subject to the award (or, in the case of performance-based awards, the target share award) and the closing price on the date of grant.
|
| | | | | | | | | | | | | | | | | | | | | | | | | | | | | | |
| Name | | Grant Date | | Estimated Future Payouts Under Non- Equity Incentive Plan Awards (1) | | Estimated Future Payouts Under Equity Incentive Plan Awards (2) | | All Other Stock Awards: Number of Shares of Stock or Units (4) (#) | | All Other Option Awards: Number of Securities Underlying Options (#) | | Exercise or Base Price of Option Awards ($/Sh) | | Grant Date Fair Value of Stock and Option Awards (5) $ |
| | | Thres- hold (3) ($) | | Target ($) | | Maximum ($) | | Thres- hold (3) (#) | | Target (#) | | Maximum (#) | | | | |
| Wessel | | — | | 97,000 |
| | 1,613,000 |
| | 3,225,000 |
| | — | | — | | — | | — | | — | | — | | — |
| | | Mar. 30, 2017 | | — | | — | | — | | 4,444 |
| | 44,444 |
| | 66,667 |
| | — | | — | | — | | 2,144,423 |
|
| | | | | | | | | | | | | | | | | | | | | | | |
| Stuart | | | | 53,000 |
| | 875,000 |
| | 1,400,000 |
| | — | | — | | — | | — | | — | | — | | — |
| | | Mar. 30, 2017 | | — | | — | | — | | 2,000 |
| | 20,000 |
| | 25,000 |
| | — | | — | | — | | 965,000 |
|
| | | | | | | | | | | | | | | | | | | | | | | |
| Orr | | — | | 49,000 |
| | 813,000 |
| | 1,300,000 |
| | — | | — | | — | | — | | — | | — | | — |
| | | Mar. 30, 2017 | | — | | — | | — | | 2,000 |
| | 20,000 |
| | 25,000 |
| | — | | — | | — | | 965,000 |
|
| | | | | | | | | | | | | | | | | | | | | | | |
| Ramos | | Feb. 8, 2017 | | — | | — | | — | | — | | — | | — | | 1,000 |
| | — | | — | | 44,250 |
|
| | | | | | | | | | | | | | | | | | | | | | | |
| Alvarado | | Feb. 8, 2017 | | — | | — | | — | | — | | — | | — | | 2,000 |
| | — | | — | | 88,500 |
|
| | | | | | | | |
| Amounts represent threshold, target and maximum potential payouts under the terms of the APIP, which is described in the “Short-Term Incentive Compensation” section of the “Compensation Discussion and Analysis” above. The actual payouts awarded under the terms of APIP were $2,825,945, $1,270,075 and $1,179,356 to Messrs. Wessel, Stuart and Orr, respectively, and such amounts are reflected in the “Summary Compensation Table” above. |
| |
(2)
| Amounts represent the number of shares granted and which may be earned under the LTIP, which is described in the “Long-Term Incentive Compensation” section of the “Compensation Discussion and Analysis” above. The awards for Messrs. Wessel, Stuart and Orr vest at the end of a cumulative three-year period ending on December 31, 2019 and therefore, none of the awards have vested. |
| |
(3)
| No award is earned if actual performance is less than this threshold amount. |
| |
(4)
| The awards for Mr. Ramos and Ms. Alvarado vest ratably over time beginning in February 2018, and become fully vested in February 2022. |
| |
(5)
| Amount represents the grant date fair value based on the target award for equity incentive plan awards. |
Outstanding Equity Awards at 2017 Fiscal Year-End
as of December 31, 2020
The following table provides information on the holdings of stock options and stock awards by the NEOs as of December 31, 2017.2020. Each outstanding option and stock award is shown separately for each NEO.
| | | | | | | | | | | | | | | | | | | | | | | | | | | | | | | | | | | | | | | | | | | | | | | | | | | | |
| | Option Awards | | Stock Awards |
| Name | | Number of
Securities
Underlying
Unexercised
Options (#)
Exercisable | | Number of
Securities
Underlying
Unexercised
Options (#)
Unexercisable | | | | Option
Exercise
Price
($) | | Option
Expiration
Date | | Number of
Shares or
Units of
Stock That
Have Not
Vested
(#) | | Market Value of Shares or Units of Stock That Have Not Vested (9) ($) | | Equity
Incentive
Plan
Awards:
Number of
Unearned
Shares,
Units or
Other Rights
That Have
Not Vested
(#) | | Equity Incentive Plan Awards: Market or Payout Value of Unearned Shares, Units or Other Rights That Have Not Vested (9) ($) |
| Wessel | | — | | | — | | | | | — | | | — | | | — | | | — | | | 53,760 | | (2) | 3,765,350 | |
| | | | | | | | | | | | | | | | 10,498 | | (3) | 735,280 | |
| | | | | | | | | | | | | | | | 16,540 | | (4) | 1,158,462 | |
| | | | | | | | | | | | | | | | | | |
| Stuart | | — | | | — | | | | | — | | | — | | | — | | | — | | | 18,816 | | (2) | 1,317,873 | |
| | | | | | | | | | | | | | | | 3,817 | | (3) | 267,343 | |
| | | | | | | | | | | | | | | | 5,513 | | (4) | 386,131 | |
| | | | | | | | | | | | | | | | | | |
| Orr | | — | | | — | | | | | — | | | — | | | — | | | — | | | 18,816 | | (2) | 1,317,873 | |
| | | | | | | | | | | | | | | | 3,817 | | (3) | 267,343 | |
| | | | | | | | | | | | | | | | 5,513 | | (4) | 386,131 | |
| | | | | | | | | | | | | | | | | | |
| Ramos | | — | | | 10,000 | | (1) | | | 38.00 | | | 11/2021 | | 400 | | (5) | 28,016 | | | — | | | — | |
| | | | | | | | | | | | 600 | | (6) | 42,024 | | | — | | | — | |
| | | | | | | | | | | | 2,400 | | (7) | 168,096 | | | | | |
| | | | | | | | | | | | 4,000 | | (8) | 280,160 | | | | | |
| | | | | | | | | | | | | | | | | | |
| Alvarado | | — | | | — | | | | | — | | | — | | | 800 | | (5) | 56,032 | | | — | | | — | |
| | | | | | | | | | | | 1,800 | | (6) | 126,072 | | | — | | | — | |
| | | | | | | | | | | | 3,200 | | (7) | 224,128 | | | | | |
| | | | | | | | | | | | 6,000 | | (8) | 420,240 | | | | | |
(1)Option award granted in 2011. Vesting is time-based with 10,000 shares vesting on July 1, 2018, 2019, 2020 and 2021, respectively.
(2)The 2018 restricted stock awards granted under the LTIP to current NEOs vested on January 31, 2021 upon the achievement of performance measures based on a three-year cumulative performance period ending on December 31, 2020. The performance measures are defined as adjusted net income growth and total store additions over the three-year cumulative period. The weighted total payout based on actual performance over the three-year cumulative performance period ended December 31, 2020 was 134% of target and resulted in 53,760 shares for the CEO and 18,816 shares for each of the COO and CFO. See “Historical LTIP Grants and Performance” section above for further information.
(3)The 2019 restricted stock awards granted under the LTIP to current NEOs are eligible for performance-based vesting on February 19, 2022 upon the achievement of performance measures based on a three-year cumulative performance period ending December 31, 2021. The performance measures are defined as adjusted net income growth, pawn revenue growth and new store openings over the three-year cumulative period. Based on the Company’s achievement of the performance measures to date (the year ended December 31, 2020), which is below the threshold, the awards are reflected at threshold payout amounts in accordance with SEC guidance. If the performance measures for the 2019 restricted stock awards resulted in a maximum grant upon completion of the vesting period, the CEO would earn 62,985 shares and the COO and CFO would each earn 22,904 shares.
|
| | | | | | | | | | | | | | | | | | | | | | | | | | | |
| | | Option Awards | | Stock Awards |
| Name | | Number of Securities Underlying Unexercised Options (#) Exercisable | | Number of Securities Underlying Unexercised Options (#) Unexercisable | | Equity Incentive Plan Awards: Number of Securities Underlying Unexercised Unearned Options (#) | | Option Exercise Price ($) | | Option Expiration Date | | Number of Shares or Units of Stock That Have Not Vested (#) | | Market Value of Shares or Units of Stock That Have Not Vested (5) ($) | | Equity Incentive Plan Awards: Number of Unearned Shares, Units or Other Rights That Have Not Vested (#) | | Equity Incentive Plan Awards: Market or Payout Value of Unearned Shares, Units or Other Rights That Have Not Vested (5) ($) |
| Wessel | | — |
| | — |
| | — |
| | — |
| | — |
| | — |
| | — |
| | 15,000 |
| (2) | 1,011,750 |
|
| | | | | | | | | | | | | | | | | 44,444 |
| (3) | 2,997,748 |
|
| | | | | | | | | | | | | | | | | | | |
| Stuart | | — |
| | — |
| | — |
| | — |
| | — |
| | — |
| | — |
| | 20,000 |
| (3) | 1,349,000 |
|
| | | | | | | | | | | | | | | | | | | |
| Orr | | — |
| | — |
| | — |
| | — |
| | — |
| | — |
| | — |
| | 5,000 |
| (2) | 337,250 |
|
| | | | | | | | | | | | | | | | | 20,000 |
| (3) | 1,349,000 |
|
| | | | | | | | | | | | | | | | | | | |
| Ramos | | — |
| | 40,000 |
| (1) | | | 38.00 |
| | 11/2021 |
| | 1,000 |
| (4) | 67,450 |
| | — |
| | — |
|
| | | | | | | | | | | | | | | | | | | |
| Alvarado | | — |
| | — |
| | — |
| | — |
| | — |
| | 2,000 |
| (4) | 134,900 |
| | — |
| | — |
|
| | | | | | | | |
| Option award granted in 2011. Vesting is time-based with 10,000 shares vesting on July 1, 2018, 2019, 2020 and 2021, respectively. | |
(4)Two-thirds of the 2020 restricted stock awards granted under the LTIP to current NEOs are eligible for performance-based vesting on December 31, 2022 upon the achievement of performance measures based on a two-year cumulative performance period ending December 31, 2022. The performance measures are defined as adjusted net income growth and new store openings over the two-year cumulative period. The remaining one-third of the 2020 restricted stock awards granted under the LTIP to current NEOs are eligible for performance-based vesting on December 31, 2023 upon the achievement of a performance measure based on a three-year cumulative performance period ending December 31, 2023. The performance measure is defined as the Company’s TSR relative to a peer group over the three-year cumulative period. As the performance periods do not start until January 1, 2021, and therefore the Company’s achievement of the performance measures to date is below the threshold, the awards are reflected at threshold payout amounts in accordance with SEC guidance. If the performance measures for the 2020 restricted stock awards resulted in a maximum grant upon completion of the vesting period, the CEO would earn 74,429 shares and the COO and CFO would each earn 24,810 shares.
(5)Restricted stock awards granted in 2017. Vesting is time-based with 20% scheduled to vest on February 8, 2018, 2019, 2020, 2021 and 2022.
(6)Restricted stock awards granted in 2018. Vesting is time-based with 20% scheduled to vest on January 30, 2019, 2020, 2021, 2022 and 2023.
(7)Restricted stock awards granted in 2019. Vesting is time-based with 20% scheduled to vest on February 19, 2020, 2021, 2022, 2023 and 2024.
(8)Restricted stock awards granted in 2020. Vesting is time-based with 20% scheduled to vest on January 28, 2021, 2022, 2023, 2024 and 2025.
(9)The market value of the unvested share awards is based on the closing price of the Company’s Common Stock as of December 31, 2020, which was $70.04.
| | | | | | | | |
| The 2016 restricted stock awards granted under the LTIP to current NEOs consisted of 30,000 shares to the CEO and 10,000 shares to the CFO; 25% of the awards were eligible for performance-based vesting based upon achievement of performance measures in 2016, 2017, 2018 and 2019. The performance measure is defined as adjusted EBITDA growth over the comparative base period. |
| |
(3)
| The 2017 restricted stock awards granted under the LTIP to current NEOs consisted of 44,444 shares to the CEO and 20,000 shares each to the COO and CFO based on the target award. The awards are eligible for performance-based vesting upon achievement of performance measures in 2019 based on a three-year cumulative performance period. The performance measures are defined as adjusted net income growth and total store additions over the three-year cumulative period. If the performance measures for the 2017 restricted stock awards resulted in a maximum grant upon completion of the vesting period, the CEO would earn 66,667 shares and the COO and CFO would each earn 25,000 shares. |
| |
(4)
| Restricted stock awards granted in 2017. Vesting is time-based with 20% scheduled to vest on February 8, 2018, 2019, 2020, 2021 and 2022. |
| |
(5)
| The market value of the unvested share awards is based on the closing price of the Company’s Common Stock as of December 31, 2017, which was $67.45. |
Option Exercises and Stock Vested in Fiscal 2017
2020
The following table provides information for the NEOs regarding (1)(i) the aggregate stock options exercised during 2017,2020, including the number of shares acquired on exercise and the value realized, and (2)(ii) the aggregate number of shares acquired upon the vesting of restricted stock awards and the value realized, each before the payment of any applicable withholding tax and broker commissions:
| | | | | | | | | | | | | | | | | | | | | | | | | | |
| | Option Awards | | Stock Awards |
| Name | | Number of
Shares Acquired
on Exercise | | Value Realized on Exercise $ (1) | | Number of
Shares Acquired
on Vesting | | Value Realized on Vesting $ (6) |
| Wessel | | — | | | — | | | 66,667 | | (2) | 4,832,024 | |
| | | | | | | | |
| Stuart | | — | | | — | | | 25,000 | | (2) | 1,812,000 | |
| | | | | | | | |
| Orr | | — | | | — | | | 25,000 | | (2) | 1,812,000 | |
| | | | | | | | |
| Ramos | | 30,000 | | | 934,500 | | | 200 | | (3) | 17,074 | |
| | | | | | 200 | | (4) | 17,336 | |
| | | | | | 600 | | (5) | 51,300 | |
| | | | | | | | |
| Alvarado | | — | | | — | | | 400 | | (3) | 34,148 | |
| | | | | | 600 | | (4) | 52,008 | |
| | | | | | 800 | | (5) | 68,400 | |
(1)Value realized represents the excess of the fair market value of the shares at the time of exercise over the exercise price of the options.
(2)In 2017, the CEO, COO and CFO were granted awards of performance-based restricted stock units under the LTIP that vested three years from the date of the grant. The 2017 grant had a three-year cumulative performance period that began on January 1, 2017 and ended on December 31, 2019. The performance measures are defined as adjusted net income growth and new store openings over the three-year cumulative period. Based on the actual three-year cumulative performance achieved, the maximum number of shares available for vesting on March 30, 2020 were awarded.
(3)In 2017, the Company granted 1,000 and 2,000 shares of time-based restricted stock units to Mr. Ramos and Ms. Alvarado, respectively. These time-based awards vest ratably over time beginning in February 2018 and become fully vested in February 2022.
(4)In 2018, the Company granted 1,000 and 3,000 shares of time-based restricted stock units to Mr. Ramos and Ms. Alvarado, respectively. These time-based awards vest ratably over time beginning in January 2019 and become fully vested in January 2023.
(5)In 2019, the Company granted 3,000 and 4,000 shares of time-based restricted stock units to Mr. Ramos and Ms. Alvarado, respectively. These time-based awards vest ratably over time beginning in February 2020 and become fully vested in February 2024.
(6)Value realized represents the value as calculated based on the price of the Company’s Common Stock on the vesting date.
|
| | | | | | | | | | | | |
| | | Option Awards | | Stock Awards |
| Name | | Number of Shares Acquired on Exercise | | Value Realized on Exercise $ | | Number of Shares Acquired on Vesting (1) | | Value Realized on Vesting $ (2) |
| Wessel | | — |
| | — |
| | 7,500 |
| | 506,000 |
|
| Stuart | | — |
| | — |
| | — |
| | — |
|
| Orr | | — |
| | — |
| | 2,500 |
| | 169,000 |
|
| Ramos | | — |
| | — |
| | — |
| | — |
|
| Alvarado | | — |
| | — |
| | — |
| | — |
|
| | | | | | | | |
| In fiscal 2016, the CEO was granted 30,000 shares and the CFO was granted 10,000 shares under the LTIP, which vest in four annual installments of 7,500 shares for the CEO and 2,500 shares for the CFO based on the attainment of an annual performance target of adjusted EBITDA. The adjusted EBITDA target for each of the annual vesting periods was set by the Compensation Committee in early 2016, which was prior to the Merger. Actual fiscal 2017 adjusted EBITDA was $273 million compared to the fiscal 2017 target of $139 million and accordingly, 100% of the shares available for vesting in 2017 were awarded. |
The following table details the number of shares acquired on exercise of option awards and vesting of restricted stock units during 2020 and shows the Company’s executives have held the shares acquired with the exception of those withheld for tax purposes:
| | | | | | | | | | | | | | | | | | | | | | | | | | |
| | | | Disposition of Shares Acquired on Exercise of Option Awards and Vesting of Restricted Stock Units | | |
| Name | | Total Shares Exercised/Vested | | Shares Sold | | Shares Withheld for Taxes | | Remaining Shares Held |
| Wessel | | 66,667 | | | — | | | (26,233) | | | 40,434 | |
| Stuart | | 25,000 | | | — | | | (9,837) | | | 15,163 | |
| Orr | | 25,000 | | | — | | | (9,837) | | | 15,163 | |
| Ramos | | 31,000 | | | — | | | — | | | 31,000 | |
| Alvarado | | 1,800 | | | — | | | — | | | 1,800 | |
Value realized represents the value as calculated based on the price of the Company’s common stock on the vesting date. |
Pension Benefits
The Company does not have a defined benefit pension plan for its employees. The only retirement plan available to the NEOs wasis the Company’s qualified 401(k) savings plan, which is available to generally all full-time U.S.-based employees.
Nonqualified Defined Contribution and Other Nonqualified Deferred Compensation Plans
Except for a nonqualified savings plan assumed from Cash America which was terminated in 2017 for which Mr. Stuart participated in, theThe Company does not have nonqualified defined contribution or other nonqualified deferred compensation plans for its employees or directors.
Employment Agreements and Change in Control Provisions
The Company and the Compensation Committee believe employment agreements are necessary in order to attract and retain key senior executives and, accordingly, the Company has entered into employment agreements with certain current NEOs. The Compensation Committee believes the employment agreements (and the change in control provisions included therein) entered into were merited in light of all relevant circumstances, including each individual’s past employment experience, desired terms and conditions of employment and the strategic importance of their respective positions, including stability and retention. The Compensation Committee reviews the agreements at the time they are entered into in order to determine current market terms for the particular executive and agreement. At the time of the Merger in 2016, the Compensation Committee engaged Pay Governance as part of this review and benchmarking process as it related to service terms under employment agreements for Messrs. Wessel, Stuart and Orr.
The Compensation Committee believes the change in control provisions are necessary in order to retain and maintain stability among the executive group and the terms of the change in control provisions are reasonable based on its review of the change in control provisions for similarly situated peer group companies. The change in control provisions in the employment agreements for certain NEOs provide for severance benefits only in the event of an involuntary termination of employment by the Company without “cause” or by the executive for “good reason,” as such terms are defined in the employment agreements.
The overall goal of the Compensation Committee is to ensure compensation policies are established consistent with the Company’s strategic business objectives and provide incentives for the attainment of those objectives. This is affected in the context of a compensation program that includes base pay,salary, annual and long-term incentive compensation and stock ownership.
The Company did not enter into any new or amended employment agreements in 2020.
Summary of Existing Employment Agreements
CEO, COO and CFO Agreements
In August 2016, the Company entered into new employment agreements with Messrs. Wessel, Stuart and Orr, the Company’s CEO, COO and CFO, respectively. The terms of these employment agreements run through December 31, 2021. The Compensation Committee believes the longer term of these contracts arethe agreements were appropriate given the transformational impact of the Merger and the desire by the stockholders for continuity in the senior management team overin the next several years.years following the Merger. Additionally, the maximum severance payouts under these contracts are capped at one year’s salary and average annual incentive for termination without cause“cause” or for good reason“good reason” or two years of salary and average annual incentive for such termination following a change in control.
The employment agreements provided for annual salaries, to be effective as of January 1, 2017, in the following amounts: $1,075,000 for Mr. Wessel, $700,000 for Mr. Stuart and $650,000 for Mr. Orr, in each case subject to annual review and increases in the discretion of the Compensation Committee. The executives are eligible to earn an annual incentive based on the satisfaction of performance criteria established by the Compensation Committee for each fiscal year during the term of the agreement, with a target incentive opportunity equal to not less than a specified percentage of the executive’s then current salary (150% in the case of Mr. Wessel; 100% in the case of Messrs. Stuart and Orr). In addition, the executives are eligible for grants of stock-based awards under the Company’s long-term equity compensation plan and will be eligible to participate in any of the Company’s incentive, savings, retirement and welfare benefit plans available to other senior officers of the Company.
The employment agreements provide that if an executive’s employment with the Company is terminated during the term by the Company without “cause” or by the executive for “good reason” (as such terms are defined in the employment agreements), the executive would be entitled to a lump sum cash severance payment equal to one times (or two times, if such termination occurs within twelve months following a change in control of the Company) the sum of (i) the executive’s salary in effect as of the termination, and (ii) the average of the annual cash incentives earned by the executive for each of the three fiscal years immediately preceding the year in which the termination occurs. The executive would also be entitled to continue to participate in the Company’s health and welfare benefit plans at active employee rates for a period of eighteen months (the “COBRA subsidy”). In addition, if such termination occurs within twelve months following a change in control of the Company, the executive would be entitled to a pro rata annual cash incentive for the year in which the termination occurs and accelerated vesting and full payout under all outstanding time-vesting and performance-based equity incentive awards (based on an assumed achievement of all relevant performance goals at “target” level, or based on a higher actual or deemed level of achievement of performance goals, in the sole discretion of the Compensation Committee). Furthermore, if such termination occurs within twelve months following a change in control of the Company, the Company will pay to the executive, in lieu of the COBRA subsidy described above, a lump sum in cash in an amount equal to the full monthly cost of the executive’s health and welfare benefit coverage multiplied by 24.
The employment agreements prohibit the executives from competing with the Company during the employment term and for a period of 24 months following termination of employment. The executives would also be prohibited from soliciting Company customers and recruiting Company employees during this period.
Other NEO Agreements
In November 2011,July 2018, the Company entered into new employment agreements with Mr. Ramos entered into anand Ms. Alvarado, the Company’s Senior Vice President, Latin America Operations and General Counsel, respectively. The terms of these employment agreement with the Company effectiveagreements run through December 31, 2021. In April 2013,The employment agreements provided for annual salaries, to be effective as of January 1, 2019, in the agreement was amendedfollowing amounts: $420,000 for Mr. Ramos and $500,000 for Ms. Alvarado, in each case subject to extend the term through December 31, 2022. The agreement, as last amended in 2013, provides for: (i) a salary of $325,000 for calendar year 2013, with annual increases in salary of $10,000 through 2022; (ii) a target annual cash incentive of $375,000 for calendar year 2013, with annualreview and increases in the discretion of the Compensation Committee. The executives are eligible to earn an annual cash bonus based on the breadth of their expertise and responsibility and the achievement of certain financial or strategic results as determined by the Compensation Committee for each year during the term of the agreement, with a target amountcash bonus opportunity equal to not less than a specified percentage of $25,000 through 2022; and (iii) certain fringe benefits.the executive’s then current salary (50% for both Mr. Ramos has agreed notand Ms. Alvarado). In addition, the executives are eligible for grants of stock-based awards under the Company’s long-term equity compensation plan and will be eligible to competeparticipate in any of the Company’s incentive, savings, retirement and welfare benefit plans available to other senior officers of the Company.
The employment agreements provide that if an executive’s employment with the Company is terminated during the term by the Company without “cause” or by the executive for “good reason” (as such terms are defined in the employment agreements), the executive would be entitled to a lump sum cash severance payment equal to 0.75 times (or 1.5 times, if such termination occurs within twelve months following a change in control of the Company) the sum of (i) the executive’s salary in effect as of the termination, and (ii) the average of the annual cash incentives earned by the executive for each of the three years immediately preceding the year in which the termination occurs. The executive would also be entitled to continue to participate in the Company’s health and welfare
benefit plans at active employee rates for a period of three years following his termination and not to solicit employees of the Company and not to solicit customers of the Company for a period of three years following his termination. In the event of termination of Mr. Ramos’ employment by the Company without cause, or due to his death or disability, Mr. Ramos (or his estate, in the event of his death) is entitled to severance payments equal to the sum of his then current annual salary for twelve months and his then current target annual incentive (prorated based on the date of termination)(the “COBRA subsidy”). In addition, in the event ofif such termination of Mr. Ramos’ employment by the Company without causeoccurs within twelve months following a change in control of the Company, the executive would be entitled to a pro rata annual cash incentive for the year in which the termination occurs and accelerated vesting and full payout under all outstanding time-vesting and performance-based equity incentive awards (based on an assumed achievement of all relevant performance goals at “target” level, or based on a higher actual or deemed level of achievement of performance goals, in the eventsole discretion of a voluntarythe Compensation Committee). Furthermore, if such termination of employment by Mr. Ramosoccurs within one year oftwelve months following a change in control of the Company, the agreement provides for severance paymentsCompany will pay to Mr. Ramosthe executive, in lieu of the COBRA subsidy described above, a lump sum in cash in an amount equal to 100%the full monthly cost of his then current annual salarythe executive’s health and welfare benefit coverage multiplied by 18.
The employment agreements prohibit the executives from competing with the Company during the employment term and for a period of 24 months.months following termination of employment. The executives would also be prohibited from soliciting Company customers and recruiting Company employees during this period.
Summary of Potential Payments Upon Termination or a Change in Control
The employment agreements provide for certain severance payments and other benefits in the event of the executive’s termination of employment or a change in control of the Company.Company followed by termination of employment. The grants have specific rules related to the treatment of the awards in the event of termination for cause, voluntary resignation, retirement, involuntary termination and change in control. The following table summarizes the value of the severance payments and other benefits that each of the NEOs would receive if employment was terminated on December 31, 20172020 under the circumstances shown. The amounts shown in the table do not include accrued but unpaid salary, earned annual incentives for 2017,2020, or payments and benefits to the extent they are provided on a non-discriminatory basis to salaried employees generally upon termination of employment, such as distributions of plan balances under the Company’s 401(k) plan, and death or disability benefits under the Company’s generally available welfare programs.
|
| | | | | | | | | | | | | | | | | | |
| Name | | Termination for Cause or Resignation without Good Reason $ | | Termination without Cause or Resignation for Good Reason $ | | Retirement $ | | Death $ | | Long-Term Disability $ | | Termination without Cause or Resignation for Good Reason in Connection with a Change in Control $ |
| Wessel | | | | | | | | | | | | |
| Cash Severance | | — |
| | 3,231,226 |
| | — |
| | — |
| | — |
| | $6,462,451 |
| Benefits Continuation | | — |
| | 21,108 |
| | — |
| | — |
| | — |
| | — |
|
| Lump sum payment for health benefits | | — |
| | — |
| | — |
| | — |
| | — |
| | 28,144 |
|
| Value of unvested equity awards | | — |
| | — |
| | — |
| | — |
| | — |
| | 4,009,498 |
|
| Total | | — |
| | 3,252,334 |
| | — |
| | — |
| | — |
| | 10,500,093 |
|
| | | | | | | | | | | | | |
| Stuart | | | | | | | | | | | | |
| Cash Severance | | — |
| | 1,610,834 |
| | — |
| | — |
| | — |
| | 3,221,667 |
|
| Benefits Continuation | | — |
| | 27,707 |
| | — |
| | — |
| | — |
| | — |
|
| Lump sum payment for health benefits | | — |
| | — |
| | — |
| | — |
| | — |
| | 36,942 |
|
| Value of unvested equity awards | | — |
| | — |
| | — |
| | — |
| | — |
| | 1,349,000 |
|
| Total | | — |
| | 1,638,541 |
| | — |
| | — |
| | — |
| | 4,607,609 |
|
| | | | | | | | | | | | | |
| Orr | | | | | | | | | | | | |
| Cash Severance | | — |
| | 1,453,059 |
| | — |
| | — |
| | — |
| | 2,906,117 |
|
| Benefits Continuation | | — |
| | 41,892 |
| | — |
| | — |
| | — |
| | — |
|
| Lump sum payment for health benefits | | — |
| | — |
| | — |
| | — |
| | — |
| | 55,856 |
|
| Value of unvested equity awards | | — |
| | — |
| | — |
| | — |
| | — |
| | 1,686,250 |
|
| Total | | — |
| | 1,494,951 |
| | — |
| | — |
| | — |
| | 4,648,223 |
|
| | | | | | | | | | | | | |
| Ramos | | | | | | | | | | | | |
| Cash Severance | | — |
| | 800,000 |
| | — |
| | $800,000 | | $800,000 | | 800,000 |
|
| Benefits Continuation | | — |
| | — |
| | — |
| | — |
| | — |
| | — |
|
| Lump sum payment for health benefits | | — |
| | — |
| | — |
| | — |
| | — |
| | — |
|
| Value of unvested equity awards | | — |
| | — |
| | — |
| | — |
| | — |
| | 1,245,450 |
|
| Total | | — |
| | 800,000 |
| | — |
| | 800,000 |
| | 800,000 |
| | 2,045,450 |
|
| | | | | | | | | | | | | | | | | | | | | | | | | | | | | | | | | | | | | | |
| Name | | Termination for Cause or Resignation without Good Reason
$ | | Termination without Cause or Resignation for Good Reason
$ | | Retirement
$ | | Death
$ | | Long-Term Disability
$ | | Termination without Cause or Resignation for Good Reason in Connection with a Change in Control
$ |
| Wessel | | | | | | | | | | | | |
Cash severance (1) | | — | | | 3,771,512 | | | — | | | — | | | — | | | 7,543,023 | |
| Benefits continuation | | — | | | 22,284 | | | — | | | — | | | — | | | — | |
| Lump sum payment for health benefits | | — | | | — | | | — | | | — | | | — | | | 29,712 | |
Value of unvested equity awards (3) | | — | | | — | | | 5,726,003 | | | 5,726,003 | | | 5,726,003 | | | 5,726,003 | |
| Total | | — | | | 3,793,796 | | | 5,726,003 | | | 5,726,003 | | | 5,726,003 | | | 13,298,738 | |
| | | | | | | | | | | | |
| Stuart | | | | | | | | | | | | |
Cash severance (1) | | — | | | 1,896,206 | | | — | | | — | | | — | | | 3,792,413 | |
| Benefits continuation | | — | | | 30,013 | | | — | | | — | | | — | | | — | |
| Lump sum payment for health benefits | | — | | | — | | | — | | | — | | | — | | | 40,017 | |
Value of unvested equity awards (3) | | — | | | — | | | — | | | 2,030,833 | | | 2,030,833 | | | 2,030,833 | |
| Total | | — | | | 1,926,219 | | | — | | | 2,030,833 | | | 2,030,833 | | | 5,863,263 | |
| | | | | | | | | | | | |
| Orr | | | | | | | | | | | | |
Cash severance (1) | | — | | | 1,768,133 | | | — | | | — | | | — | | | 3,536,267 | |
| Benefits continuation | | — | | | 19,561 | | | — | | | — | | | — | | | — | |
| Lump sum payment for health benefits | | — | | | — | | | — | | | — | | | — | | | 26,082 | |
Value of unvested equity awards (3) | | — | | | — | | | — | | | 2,030,833 | | | 2,030,833 | | | 2,030,833 | |
| Total | | — | | | 1,787,694 | | | — | | | 2,030,833 | | | 2,030,833 | | | 5,593,182 | |
| | | | | | | | | | | | |
| Ramos | | | | | | | | | | | | |
Cash severance (2) | | — | | | 915,673 | | | — | | | — | | | — | | | 1,831,345 | |
| Benefits continuation | | — | | | 22,692 | | | — | | | — | | | — | | | — | |
| Lump sum payment for health benefits | | — | | | — | | | — | | | — | | | — | | | 34,038 | |
| Value of unvested equity awards | | — | | | — | | | — | | | 838,696 | | | 838,696 | | | 838,696 | |
| Total | | — | | | 938,365 | | | — | | | 838,696 | | | 838,696 | | | 2,704,079 | |
| | | | | | | | | | | | |
| Alvarado | | | | | | | | | | | | |
Cash severance (2) | | — | | | 725,563 | | | — | | | — | | | — | | | 1,451,125 | |
| Benefits continuation | | — | | | 22,775 | | | — | | | — | | | — | | | — | |
| Lump sum payment for health benefits | | — | | | — | | | — | | | — | | | — | | | 34,162 | |
| Value of unvested equity awards | | — | | | — | | | — | | | 826,472 | | | 826,472 | | | 826,472 | |
| Total | | — | | | 748,338 | | | — | | | 826,472 | | | 826,472 | | | 2,311,759 | |
(1)Cash severance is equal to one times (or two times, if such termination occurs within twelve months following a change in control of the Company) the sum of (i) the executive’s salary in effect as of the termination, and (ii) the average of the annual cash incentives earned by the executive for each of the three years immediately preceding the year in which the termination occurs.
(2)Cash severance is equal to 0.75 times (or 1.5 times, if such termination occurs within twelve months following a change in control of the Company) the sum of (i) the executive’s salary in effect as of the termination, and (ii) the average of the annual cash incentives earned by the executive for each of the three years immediately preceding the year in which the termination occurs.
(3)Value of unvested performance based equity awards is equal to the pro rata number of restricted stock awards deemed to have been earned based upon an assumed achievement of the performance measures at target times the December 31, 2020 stock price. For the 2018 LTIP grant, the actual shares vested were used as the performance period ended on December 31, 2020 and for the 2020 replacement LTIP grant, no assumed shares were used as the performance period did not start until January 1, 2021.
CEO Pay Ratio
The Company seeks to establish fair and competitive employee compensation programs in each local market within its international operations in order to effectively attract, retain and motivate its talented workforce.
As required by Item 402(u)For 2020, the ratio of Regulation S-K,the CEO’s total compensation to the Company’s median employee’s total compensation was 1,560 to 1. To calculate this ratio, the Company is providing the following information to explain the relationship between the annual total compensation ofidentified its median employee and the annual total compensationas of its CEO.
The Company selected December 31, 2017 as its determination date, and used this date to identify the population of employees to be included in its calculations. On December 31, 2017, the Company and its consolidated subsidiaries employed approximately 17,000 individuals, with 7,882 employees2020 based in the U.S. and 8,359 employees based in Latin America where employee wages are much lower than in the U.S.
The Company selectedon employees’ gross wages as of its December 31, 2017 determination date as the most appropriate measure of compensation for identifying its median employee and applied this measure consistently across its employee population. Gross wagesearnings, which generally included salary and wages (regular, hourly and overtime), commissions and bonuses. The Company annualized the compensation of all permanent full-timebonuses, and part-time employees who were hired by the Company between January 1, 2017 and December 31, 2017. The Company applied an average exchange rate as of December 31, 20172020 to convert all Latin American currenciescompensation into U.S. dollars.
The Company calculated the median employee’s annual total Compensation was annualized for full-time and part-time employees who worked less than a full year, but compensation in accordance with the requirements of Item 402(c)(2) of Regulation S-K (the rules used to calculate the compensation included in the Summary Compensation Table). Using this methodology, the Company determined that itsfor part-time employees was not converted into a full-time equivalent. The median employee identified was a full-time store employee located in Latin America, with annualwhere employee wages are significantly lower than in the U.S., and the employee’s total compensation inclusive of benefits, of $11,158.
For 2017, the annualfor 2020 was $6,723, as compared to total compensation of $10,488,603 for the Company’s CEO was $6,171,999 (which isas determined in accordance with Item 402(c)(2)(x) of Regulation S-K.
The total 2020 compensation presented for the Company’s CEO includes the sum of a performance-based award grant in January 2020, which was subsequently cancelled in December 2020, plus a smaller replacement performance-based award granted in December 2020. Excluding the amount set forthcancelled January 2020 award, the CEO’s total 2020 compensation would have been $6,601,272, resulting in the “total” column of the 2017 Summary Compensation Table and the estimated cost of health and welfare benefits that are available generally to all salaried employees). Based on the Company’s CEO’s annual total compensation compared to the compensation for the median employee, the Company’s estimateda pay ratio as calculated pursuantof 982 to the SEC regulations is 553:1.
The Company’s estimated pay ratio is influenced by a number of factors, including the geographic distribution of its employees, the mix of hourly vs. salaried employees included in its employee population, and compensation trends within its specific industry. As a result of these and other variables, the Company does not believe comparisons to the pay ratios of other companies are likely to be meaningful.
PROPOSAL 3
ADVISORY VOTE TO APPROVE THE COMPENSATION OF THE COMPANY’S NAMED EXECUTIVE OFFICERS
Under Section 14A of the Exchange Act, the Company’s stockholders are entitled to vote to approve, on an advisory basis, the compensation of the NEOs, as disclosed in this Proxy Statement in accordance with SEC rules (commonly known as a “say-on-pay” proposal).
At the 20172020 Annual Meeting, the Company held its non-binding stockholder advisory vote on executive compensation and approximately 90%96% of the shares present and entitled to vote were cast to support the compensation of the Company’s NEOs. In addition, the Company held its non-binding stockholder advisory vote on the frequency for future advisory votes with respect to NEO compensation and 81% voted for approval of an annual frequency. In light of the vote, the Board of Directors has determined to hold an advisory vote on the compensation of the NEOs each year until the next non-binding stockholder advisory vote on the frequency of such votes, which is required to be held no later than the Company’s 2023 Annual Meeting of Stockholders.
The Board is seeking the advisory vote of stockholders on the compensation of the NEOs as disclosed in this Proxy Statement. This say-on-pay proposal gives the Company’s stockholders the opportunity to express their views on the Company’s NEOs’ compensation. This vote is not intended to address any specific item of compensation, but rather the overall compensation of the NEOs.
As discussed in “Compensation Discussion and Analysis,” the Company has designed its executive compensation program to attract and retain the highest quality executive officers, directly link pay to performance, and build value for stockholders. The program provides total compensation opportunities at levels that are competitive in the industry, tiestie a significant portion of each executive’s compensation to his or her individual performance and contribution to achieving business objectives, and closely alignsalign the interests of the executives with the interests of the Company’s stockholders. Accordingly, the Board of Directors invites you to review carefully the Compensation Discussion and Analysis and the tabular and other disclosures on compensation under executive compensation, and cast a vote to approve the compensation of the Company’s NEOs through the following resolution:
“RESOLVED, that the Company’s stockholders approve, on an advisory basis, the compensation of the NEOs, as disclosed in the Company’s Proxy Statement for the 20182021 Annual Meeting pursuant to the compensation disclosure rules of the SEC, including the Compensation Discussion and Analysis, the 20172020 Summary Compensation Table and the other related tables and disclosure.”
The say-on-pay vote is advisory, and therefore not binding on the Company, the Compensation Committee or the Board of Directors. The Board of Directors and Compensation Committee value the opinions of the Company’s stockholders and to the extent there is any significant vote against the NEO compensation as disclosed in this Proxy Statement, the Compensation Committee or the Board of Directors will consider the Company’s stockholders’ concerns and will evaluate whether any actions are necessary to address those concerns.
At the 2017 Annual Meeting of Stockholders, the Company’s stockholders selected, on a non-binding, advisory basis, an annual vote for the frequency at which the Company should include a say-on-pay proposal in its proxy statement for stockholder consideration. In light of this result and other factors, the Board of Directors determined that the Company will hold say on pay votes every year until the next required non-binding, advisory vote on the frequency of such votes, which is required to be held no later than the Company’s 2023 Annual Meeting of Stockholders.
Required Vote
Approval of this resolution requires the affirmative vote of a majority of the shares of Common Stock present or represented by proxy at the Annual Meeting and entitled to vote.
Recommendation of the Board of Directors
The Board of Directors unanimously recommends a vote “FOR” the resolution approving the overall compensation of the NEOs for the 2020.
2017 fiscal year.
OTHER MATTERS
Management is not aware of any other matters to be presented for action at the Annual Meeting. However, if any other matter is properly presented, it is the intention of the persons named in the enclosed form of proxy to vote in accordance with their best judgment on such matter. Neither Delaware law nor the Company’s certificate of incorporation or bylaws provides stockholders with dissenters’ rights in connection with any of the proposals to be voted on at the Annual Meeting.
COST OF SOLICITATION
The Company will bear the costs of the solicitation of proxies from its stockholders. In addition to the use of mail, directors, officers and regular employees of the Company may solicit proxies in person or by telephone or other means of communication. The directors, officers and employees of the Company will not be compensated additionally for the solicitation but may be reimbursed for out-of-pocket expenses in connection with the solicitation. Arrangements are also being made with brokerage houses and any other custodians, nominees and fiduciaries of the forwarding of solicitation material to the beneficial owners of the Company’s Common Stock, and the Company will reimburse the brokers, custodians, nominees and fiduciaries for their reasonable out-of-pocket expenses.
HOUSEHOLDING OF PROXY MATERIALS
The Company has adopted a practice approved by the SEC called “householding.” Under this practice, stockholders who have the same address and last name will receive only one copy of the Company’s proxy materials, unless one or more of these stockholders notifies the Company that he or she wishes to receive individual copies. Stockholders who participate in householding will continue to receive separate proxy cards. You may revoke your consent to householding at any time by contacting your broker or bank if you hold your shares in a “street name,” or by writing to Broadridge Financial Solutions, Inc., Householding Department, 51 Mercedes Way, Edgewood, New York 11717 or calling (866) 540-7095 if you are a stockholder of record. If you share an address with another stockholder and received only one set of proxy materials and would like to request a separate paper copy of these materials, please direct your written request to the Corporate Secretary, at 1600 West 7th Street, Fort Worth, Texas 76102, and the Company will promptly deliver a separate copy.
STOCKHOLDER PROPOSALS
The Company has not received any stockholder proposals for this Annual Meeting. Proposals by stockholders intended to be presented at next year’s Annual Meeting of Stockholders and to be considered must be received by the Company for inclusion in the Company’s Proxy Statement and form of proxy relating to that meeting no later than December 28, 201824, 2021 and the proposal must otherwise comply with Rule 14a-8 promulgated by the SEC pursuant to the Exchange Act. Separate and apart from the requirements of Rule 14a-8 relating to inclusion of a stockholders’ proposal in the Company’s Proxy Statement, the Company’s bylaws require advance notice for a stockholder to bring nominations of directors or any other action before any annual meeting of stockholders. Specifically, Section 3.5 of the Company’s bylaws requires notice of nominations of directors or any other action to be received by the Company not less than sixty (60)ninety (90) days (January 23, 2022) nor more than ninety (90)one hundred twenty (120) days (December 24, 2021) prior to the anniversary date of such annual meeting;the filing of this year’s proxy statement with the SEC, provided, however, that in the event less than 75 days’ notice ofthat the date of the annual meeting is givenadvanced by more than thirty (30) days or madedelayed (other than as a result of adjournment) by more than sixty (60) days from the anniversary of the previous year’s annual meeting, a notice of nominations of directors or any other action to stockholders, noticebe received by the stockholder to be timelyCompany must be so received notno later than the close of business on the 15thlater of the ninetieth (90th) day prior to such annual meeting or the tenth (10th) day following the dateday on which such noticepublic announcement of the date of the annualsuch meeting was mailed.is first made. Further, the notice must contain the information set forth in Section 3.5 of the Company’s bylaws.
|
| | | | |
| By Order of the Board of Directors, |
| |
| R. Douglas Orr |
| Executive Vice President, Chief Financial Officer, Treasurer and Secretary |
| |
| Fort Worth, Texas | R. Douglas Orr |
April 27, 201823, 2021 | Executive Vice President, Chief Financial Officer,
Treasurer and Secretary
|
VOTE BY INTERNET - www.proxyvote.com
Use the Internet to transmit your voting instructions and for electronic delivery of information up until 11:59 P.M. Eastern Time the day before the cut-off date or meeting date. Have your proxy card in hand when you access the web site and follow the instructions to obtain your records and to create an electronic voting instruction form.
ELECTRONIC DELIVERY OF FUTURE PROXY MATERIALS
If you would like to reduce the costs incurred by FirstCash, Inc. in mailing proxy materials, you can consent to receiving all future proxy statements, proxy cards and annual reports electronically via e-mail or the Internet. To sign up for electronic delivery, please follow the instructions above to vote using the Internet and, when prompted, indicate that you agree to receive or access stockholder communications electronically in future years.
VOTE BY PHONE - 1-800-690-6903
Use any touch-tone telephone to transmit your voting instructions up until 11:59 P.M. Eastern Time the day before the cut-off date or meeting date. Have your proxy card in hand when you call and then follow the instructions.
VOTE BY MAIL
Mark, sign and date your proxy card and return it in the postage-paid envelope we have provided or return it to Vote Processing, c/o Broadridge, 51 Mercedes Way, Edgewood, NY 11717.
As part of the Company’s precautions regarding the coronavirus or COVID-19, the Company is planning for the possibility that the Annual Meeting may be held by means of remote communication only (i.e., a virtual meeting). If the Company takes this step, or if the time, date or place of the Annual Meeting will be changing, the Company will announce the decision to do so in advance, and details on how to participate will be available on the Investor Relations page of the Company’s website (investors.firstcash.com).
REVOCABLE PROXY
FIRSTCASH, INC.
ANNUAL MEETING OF STOCKHOLDERS
June 12, 20183, 2021
THIS PROXY IS SOLICITED ON BEHALF OF THE BOARD OF DIRECTORS OF FIRSTCASH, INC. THE SHARES REPRESENTED BY THIS PROXY WILL BE VOTED IN ACCORDANCE WITH THE CHOICES SPECIFIED BELOW. IF NO SUCH DIRECTIONS ARE MADE, THIS PROXY WILL BE VOTED IN ACCORDANCE WITH THE BOARD OF DIRECTORS’ RECOMMENDATIONS BELOW. IN THEIR DISCRETION, MESSRS. WESSEL AND ORR ARE AUTHORIZED TO VOTE UPON SUCH OTHER BUSINESS AS MAY PROPERLY COME BEFORE THE MEETING OR ANY ADJOURNMENTS THEREOF.
The undersigned hereby appoints Rick L. Wessel and R. Douglas Orr the true and lawful attorneys, agents and proxies of the undersigned with full power of substitution for and in the name of the undersigned, to vote all the shares of Common Stock of FirstCash, Inc. which the undersigned may be entitled to vote at the Annual Meeting of Stockholders of FirstCash, Inc. to be held at 1600 West 7th Street, Fort Worth, Texas 76102 on Tuesday, Thursday, June 12, 20183, 2021 at 10:00 a.m., and any and all adjournments thereof, with all of the powers which the undersigned would possess if personally present, for the following purposes. This proxy will be voted for the choice specified; however you need not mark any boxes if you wish to vote in accordance with the Board of Directors’ recommendations.
|
| | | | | | | | | | | | | |
| | | | | | For All | Withhold All | For All Except | | To withhold authority to vote for any individual nominee(s), mark “For All Except” and write the number(s) of the nominee(s) on the line below. | | |
| The Board of Directors recommends you vote FOR the following proposals: | | | |
| | | | | | | | | | | |
| 1. | Election of Directors | [ ] | [ ] | [ ] | | | | |
| | Nominees: | | | | | | | | | |
| | | | | | | | | | | | | | |
| 01 | Mr. Rick L. Wessel | | 02 | Mr. James H. Graves | | | | | |
| | For | Against | Abstain |
| 2. | Ratification of the selection of RSM US LLP as the independent registered public accounting firm of the Company for the year ending December 31, 2018. | [ ] | [ ] | [ ] |
| | | | | | | | | | | | | | |
| 3. | Approve, by non-binding vote, the compensation of named executive officers as described in the proxy statement. | [ ] | [ ] | [ ] |
| | | | | | | | | | | | | | |
NOTE: Such other business as may properly come before the meeting or any adjournment thereof. | | | | |
| | | | | | |
| (Date) | | | (Signature) | | (Signature if jointly held) |
| | | | | | | | | | | | | | |
| | | | | Please sign exactly as your name(s) appear(s) hereon. When signing as attorney, executor, administrator, or other fiduciary, please give full title as such. Joint owners should each sign personally. All holders must sign. If a corporation or partnership, please sign in full corporate or partnership name, by authorized officer. |
| | | | | | | | | | | | | | | | | | | | | | | |
The Board of Directors recommends you vote FOR
the following proposals: | | | |
| | | | | | | |
| 1. | Election of Directors | | | |
| Nominees: | For | Against | Abstain |
| 1a. | Mr. Rick L. Wessel | | | | o | o | o |
| 1b. | Mr. James H. Graves | | | | o | o | o |
| | | | | | | |
| 2. | Ratification of the selection of RSM US LLP as the independent registered public accounting firm of the Company for the year ending December 31, 2021. | o | o | o |
| | | | | | | |
| 3. | Approve, by non-binding vote, the compensation of named executive officers as described in the proxy statement. | o | o | o |
| | | | | | | |
NOTE: Such other business as may properly come before the meeting or any adjournment thereof. As part of the Company’s precautions regarding the Coronavirus or COVID-19, the Company is planning for the possibility that the Annual Meeting may be held by means of remote communication only (i.e., a virtual meeting). If the Company takes this step, or if the time, date or place of the Annual Meeting will be changing, the Company will announce the decision to do so in advance, and details on how to participate will be available on the Investor Relations page of the Company’s website (investors.firstcash.com). | | | |
| | | | | | | |
| Please sign exactly as your name(s) appear(s) hereon. When signing as attorney, executor, administrator, or other fiduciary, please give full title as such. Joint owners should each sign personally. All holders must sign. If a corporation or partnership, please sign in full corporate or partnership name, by authorized officer. | | | |
| | | | | |
| | | | |
| Signature [PLEASE SIGN WITHIN BOX] | Date | | Signature (Joint Owners) | | Date |
APPENDIX A
Non-GAAP Financial Information
The Company uses certain financial calculations such as adjusted net income, adjusted net incomediluted earnings per share, EBITDA, adjusted EBITDA free cash flow, adjusted free cash flow and constant currency results (as defined or explained below) as factors in the measurement and evaluation of the Company’s operating performance and period-over-period growth. The Company derives these financial calculations on the basis of methodologies other than GAAP, primarily by excluding from a comparable GAAP measure certain items the Company does not consider to be representative of its actual operating performance. These financial calculations are “non-GAAP financial measures” as defined inunder the SEC rules. The Company uses these non-GAAP financial measures in operating its business because management believes they are less susceptible to variances in actual operating performance that can result from the excluded items, other infrequent charges and currency fluctuations. The Company presents these financial measures to investors because management believes they are useful to investors in evaluating the primary factors that drive the Company’s core operating performance and because management believes they provide greater transparency into the Company’s results of operations. However, items that are excluded and other adjustments and assumptions that are made in calculating adjusted net income, adjusted net income per share, EBITDA, adjusted EBITDA, free cash flow, adjusted free cash flow and constant currency resultsthese non-GAAP financial measures are significant components in understanding and assessing the Company’s financial performance. These non-GAAP financial measures should be evaluated in conjunction with, and are not a substitute for, the Company’s GAAP financial measures. Further, because these non-GAAP financial measures are not determined in accordance with GAAP and are thus susceptible to varying calculations, adjusted net income, adjusted net income per share, EBITDA, adjusted EBITDA, free cash flow, adjusted free cash flow and constant currency results,the non-GAAP financial measures, as presented, may not be comparable to other similarly titled measures of other companies.
While acquisitions are an important part of the Company’s overall strategy, the Company has adjusted the applicable financial calculations to exclude merger and acquisition expenses to allow more accurate comparisons of the financial results to prior periods. In addition, the Company does not consider these merger and acquisition expenses to be related to the organic operations of the acquired businesses or its continuing operations and such expenses are generally not relevant to assessing or estimating the long-term performance of the acquired businesses. Merger and acquisition expenses include incremental costs directly associated with merger and acquisition activities, including professional fees, legal expenses, severance, retention and other employee-related costs, contract breakage costs and costs related to the consolidation of technology systems and corporate facilities, among others.
The Company has certain leases in Mexico which are denominated in U.S. dollars. The lease liability of these U.S. dollar denominated leases, which is considered a monetary liability, is remeasured into Mexican pesos using current period exchange rates resulting in the recognition of foreign currency exchange gains or losses. The Company has adjusted the applicable financial measures to exclude among other expensesthese remeasurement gains or losses because they are non-cash, non-operating items that could create volatility in the Company’s consolidated results of operations due to the magnitude of the end of period lease liability being remeasured and benefits, Merger related expenses because it generally would not incur such costs and expenses as partto improve comparability of its continuing operations. The Merger related expenses are predominantly incremental costs directly associatedcurrent periods presented with prior periods due to the adoption of ASC 842 on January 1, 2019.
In conjunction with the Merger and integrationCash America merger in 2016, the Company recorded certain lease intangibles related to above or below market lease liabilities of Cash America including professional fees, legal expenses, severancewhich are included in the operating lease right of use asset on the consolidated balance sheets. As the Company continues to opportunistically purchase real estate from landlords at certain Cash America stores, the associated lease intangible, if any, is written-off and retention payments, accelerated vestinggain or loss is recognized. The Company has adjusted the applicable financial measures to exclude these gains or losses given the variability in size and timing of certain equity compensation awards, contract breakage coststhese transactions and costs related to consolidationbecause they are non-cash, non-operating gains or losses. The Company believes this improves comparability of technology systems and corporate facilities.operating results for current periods presented with prior periods.
Adjusted Net Income and Adjusted Net IncomeDiluted Earnings Per Share
Management believes the presentation of adjusted net income and adjusted net incomediluted earnings per share (“Adjusted Income Measures”) provides investors with greater transparency and provides a more complete understanding of the Company’s financial performance and prospects for the future by excluding items that management believes are non-operating in nature and not representative of the Company’s core operating performance.performance of its continuing operations. In addition, management believes the adjustments shown below are useful to investors in order to allow them to compare the Company’s financial results for the current periods presented with the prior periods presented.
The following table provides a reconciliation between the net income and diluted earnings per share calculated in accordance with GAAP to the Adjusted Income Measures,adjusted net income and adjusted diluted earnings per share, which are shown net of tax (unaudited, in thousands, except per share amounts):
| | | | | | | | | | | | | | | | | | | | | | | | | | | | | | | | | | | | | | | | | | | | | | | |
| Year Ended December 31, |
| | 2020 | | 2019 | | 2018 | | 2017 |
| In Thousands | | Per Share | | In Thousands | | Per Share | | In Thousands | | Per Share | | In Thousands | | Per Share |
| Net income and diluted earnings per share, as reported | $ | 106,579 | | | $ | 2.56 | | | $ | 164,618 | | | $ | 3.81 | | | $ | 153,206 | | | $ | 3.41 | | | $ | 143,892 | | | $ | 3.00 | |
| Adjustments, net of tax: | | | | | | | | | | | | | | | |
| | | | | | | | | | | | | | | |
| | | | | | | | | | | | | | | |
| | | | | | | | | | | | | | | |
| | | | | | | | | | | | | | | |
| Merger and acquisition expenses | 991 | | | 0.02 | | | 1,276 | | | 0.03 | | | 5,412 | | | 0.12 | | | 5,710 | | | 0.12 | |
| Non-cash foreign currency loss (gain) related to lease liability | 874 | | | 0.02 | | | (653) | | | (0.01) | | | — | | | — | | | — | | | — | |
| Loss on extinguishment of debt | 9,037 | | | 0.22 | | | — | | | — | | | — | | | — | | | 8,892 | | | 0.19 | |
| Non-cash write-off of certain Cash America merger related lease intangibles | 5,432 | | | 0.13 | | | — | | | — | | | — | | | — | | | — | | | — | |
Non-cash impairment of certain other assets (1) | 1,463 | | | 0.04 | | | — | | | — | | | — | | | — | | | — | | | — | |
| Accrual of pre-merger Cash America income tax liability | 693 | | | 0.02 | | | — | | | — | | | — | | | — | | | — | | | — | |
| Consumer lending wind-down costs and asset impairments | 84 | | | — | | | 2,659 | | | 0.06 | | | 1,166 | | | 0.03 | | | — | | | — | |
| Net tax benefit from Tax Cuts and Jobs Act | — | | | — | | | — | | | — | | | (1,494) | | | (0.03) | | | (27,269) | | | (0.57) | |
| | | | | | | | | | | | | | | |
| Adjusted net income and diluted earnings per share | $ | 125,153 | | | $ | 3.01 | | | $ | 167,900 | | | $ | 3.89 | | | $ | 158,290 | | | $ | 3.53 | | | $ | 131,225 | | | $ | 2.74 | |
(1)Impairment related to a non-operating asset in which the Company determined that an other than temporary impairment existed as of March 31, 2020.
|
| | | | | | | | | | | | | | | | | | | | | | | |
| | Year Ended December 31, |
| | 2017 | | 2016 | | 2015 |
| | In Thousands | | Per Share | | In Thousands | | Per Share | | In Thousands | | Per Share |
| Net income, as reported | $ | 143,892 |
| | $ | 3.00 |
| | $ | 60,127 |
| | $ | 1.72 |
| | $ | 60,710 |
| | $ | 2.14 |
|
| Adjustments, net of tax: | | | | | | | | | | | |
| Merger and other acquisition expenses: | | | | | | | | | | | |
| Transaction | — |
| | — |
| | 14,399 |
| | 0.41 |
| | — |
| | — |
|
| Severance and retention | 2,456 |
| | 0.05 |
| | 9,594 |
| | 0.27 |
| | — |
| | — |
|
| Other | 3,254 |
| | 0.07 |
| | 2,030 |
| | 0.06 |
| | 1,989 |
| | 0.07 |
|
| Total Merger and other acquisition expenses | 5,710 |
| | 0.12 |
| | 26,023 |
| | 0.74 |
| | 1,989 |
| | 0.07 |
|
| Net tax benefit from Tax Act | (27,269 | ) | | (0.57 | ) | | — |
| | — |
| | — |
| | — |
|
| Loss on extinguishment of debt | 8,892 |
| | 0.19 |
| | — |
| | — |
| | — |
| | — |
|
| Net gain on sale of common stock of Enova | — |
| | — |
| | (818 | ) | | (0.02 | ) | | — |
| | — |
|
| Restructuring expenses related to U.S. consumer loan operations | — |
| | — |
| | — |
| | — |
| | 5,784 |
| | 0.21 |
|
| Adjusted net income | $ | 131,225 |
| | $ | 2.74 |
| | $ | 85,332 |
| | $ | 2.44 |
| | $ | 68,483 |
| | $ | 2.42 |
|
Earnings Before Interest, Taxes, Depreciation and Amortization (EBITDA) and Adjusted EBITDA
The Company defines EBITDA as net income before income taxes, depreciation and amortization, interest expense and interest income and adjusted EBITDA as EBITDA adjusted for certain items as listed below that management considers to be non-operating in nature and not representative of its actual operating performance. The Company believes EBITDA and adjusted EBITDA are commonly used by investors to assess a company’s financial performance, and adjusted EBITDA is used in the calculation of the Net Debt Ratio as defined in the Company’s senior unsecured notes covenants. The following table provides a reconciliation of net income to EBITDA and adjusted EBITDA (unaudited, dollars in thousands):
| | | | | | | | | | | | | | | | | | | | | | | | | | | | | | | | | | | |
| Year Ended December 31, |
| 2020 | | 2019 | | 2018 | | 2017 |
| Net income | $ | 106,579 | | | $ | 164,618 | | | $ | 153,206 | | | $ | 143,892 | |
| Income taxes | | 37,120 | | | | 59,993 | | | | 52,103 | | | | 28,420 | |
| Depreciation and amortization | | 42,105 | | | | 41,904 | | | | 42,961 | | | | 55,233 | |
| Interest expense | | 29,344 | | | | 34,035 | | | | 29,173 | | | | 24,035 | |
| Interest income | | (1,540) | | | | (1,055) | | | | (2,444) | | | | (1,597) | |
| EBITDA | | 213,608 | | | | 299,495 | | | | 274,999 | | | | 249,983 | |
| Adjustments: | | | | | | | | | | | |
| Merger and acquisition expenses | | 1,316 | | | | 1,766 | | | | 7,643 | | | | 9,062 | |
| Non-cash foreign currency loss (gain) related to lease liability | | 1,249 | | | | (933) | | | | — | | | | — | |
| Loss on extinguishment of debt | | 11,737 | | | | — | | | | — | | | | 14,114 | |
| Non-cash write-off of certain Cash America merger related lease intangibles | | 7,055 | | | | — | | | | — | | | | — | |
| Non-cash impairment of certain other assets | | 1,900 | | | | — | | | | — | | | | — | |
| | | | | | | | | | | |
| Consumer lending wind-down costs and asset impairments | | 109 | | | | 3,454 | | | | 1,514 | | | | — | |
| Adjusted EBITDA | $ | 236,974 | | | $ | 303,782 | | | $ | 284,156 | | | $ | 273,159 | |
| | | | | | | | | | | |
| | | | | | | | | | | |
| | | | | | | | | | | |
| | | | | | | | | | | |
| | | | | | | | | | | |
| | | | | | | |
| | | | | | | | | | | |
| | | | | | | | | | | |
| | | | | | | | | | | |
| | | | | | | | | | | |
| | | | | | | |
|
| | | | | | | | | | | |
| | Year Ended December 31, |
| | 2017 | | 2016 | | 2015 |
| Net income | $ | 143,892 |
| | $ | 60,127 |
| | $ | 60,710 |
|
| Income taxes | | 28,420 |
| | | 33,320 |
| | | 26,971 |
|
Depreciation and amortization (1) | | 55,233 |
| | | 31,865 |
| | | 17,446 |
|
| Interest expense | | 24,035 |
| | | 20,320 |
| | | 16,887 |
|
| Interest income | | (1,597 | ) | | | (751 | ) | | | (1,566 | ) |
| EBITDA | | 249,983 |
| | | 144,881 |
| | | 120,448 |
|
| Adjustments: | | | | | | | | |
| Merger and other acquisition expenses | | 9,062 |
| | | 36,670 |
| | | 2,875 |
|
| Loss on extinguishment of debt | | 14,114 |
| | | — |
| | | — |
|
| Net gain on sale of common stock of Enova | | — |
| | | (1,299 | ) | | | — |
|
| Restructuring expenses related to U.S. consumer loan operations | | — |
| | | — |
| | | 8,878 |
|
| Adjusted EBITDA | $ | 273,159 |
| | $ | 180,252 |
| | $ | 132,201 |
|
| | | | | | | | | |
| Net Debt Ratio calculated as follows: | | | | | | | | |
| Total debt (outstanding principal) | $ | 407,000 |
| | $ | 460,000 |
| | $ | 258,000 |
|
| Less: cash and cash equivalents | | (114,423 | ) | | | (89,955 | ) | | | (86,954 | ) |
| Net debt | $ | 292,577 |
| | $ | 370,045 |
| | $ | 171,046 |
|
| Adjusted EBITDA | $ | 273,159 |
| | $ | 180,252 |
| | $ | 132,201 |
|
| Net Debt Ratio | 1.1 | :1 | | 2.1 | :1 | | 1.3 | :1 |
| |
(1)
| For fiscal 2015, excludes $0.5 million of depreciation and amortization, which is included in the restructuring expenses related to U.S. consumer loan operations. |
Free Cash Flow and Adjusted Free Cash Flow
For purposes of its internal liquidity assessments, the Company considers free cash flow and adjusted free cash flow. The Company defines free cash flow as cash flow from operating activities less purchases of property and equipment and net fundings/repayments of pawn and consumer loans, which are considered to be operating in nature by the Company but are included in cash flow from investing activities, and adjusted free cash flow as free cash flow adjusted for Merger related expenses paid that management considers to be non-operating in nature. Free cash flow and adjusted free cash flow are commonly used by investors as an additional measure of cash generated by business operations that may be used to repay scheduled debt maturities and debt service or, following payment of such debt obligations and other non-discretionary items, may be available to invest in future growth through new business development activities or acquisitions, repurchase stock, pay cash dividends or repay debt obligations prior to their maturities. These metrics can also be used to evaluate the Company’s ability to generate cash flow from business operations and the impact that this cash flow has on the Company’s liquidity. However, free cash flow and adjusted free cash flow have limitations as analytical tools and should not be considered in isolation or as a substitute for cash flow from operating activities or other income statement data prepared in accordance with GAAP. The following table reconciles net cash flow from operating activities to free cash flow and adjusted free cash flow (unaudited, in thousands):
|
| | | | | | | | | | | |
| | Year Ended December 31, |
| | 2017 | | 2016 | | 2015 |
| Cash flow from operating activities | $ | 220,357 |
| | $ | 96,854 |
| | $ | 92,749 |
|
| Cash flow from investing activities: | | | | | |
| Loan receivables, net of cash repayments | 40,735 |
| | (16,072 | ) | | (3,716 | ) |
Purchases of property and equipment (1) | (37,135 | ) | | (33,863 | ) | | (21,073 | ) |
| Free cash flow | 223,957 |
| | 46,919 |
| | 67,960 |
|
| Merger related expenses paid, net of tax benefit | 6,659 |
| | 20,939 |
| | — |
|
| Adjusted free cash flow | $ | 230,616 |
| | $ | 67,858 |
| | $ | 67,960 |
|
| |
(1)
| Includes $11.2 million, $13.4 million and $3.6 million of real estate expenditures primarily at existing stores for the twelve months ended December 31, 2017, 2016 and 2015, respectively. |
Constant Currency Results
The Company’s reporting currency is the U.S. dollar. However, certain performance metrics discussed in this Proxy Statement are presented on a “constant currency” basis, which is considered a non-GAAP measurement of financial performance. The Company’s management uses constant currency results to evaluate operating results of business operations in Latin America, which are primarily transacted in local currencies.
The Company believes constant currency results provide investors with valuable supplemental information regarding the underlying performance of its business operations in Latin America, consistent with how the Company’s management evaluates such performance and operating results. Constant currency results reported herein are calculated by translating certain balance sheet and income statement items denominated in local currencies using the exchange rate from the prior-year comparable period, as opposed to the current comparable period, in order to exclude the effects of foreign currency rate fluctuations for purposes of evaluating period-over-period comparisons. Business operations in Mexico and Guatemala are transacted in Mexican pesos and Guatemalan quetzales, respectively. The Company also has operations in El Salvador where the reporting and functional currency is the U.S. dollar.
The following tables provide exchange rates for the Mexican peso and Guatemalan quetzal for the current and prior year periods:
|
| | | | | | | | | | | | | | | | |
| | | 2017 | | | 2016 | | | 2015 |
| | | Rate | | % Change Over Prior Year Period Favorable / (Unfavorable) | | Rate | | % Change Over Prior Year Period Favorable / (Unfavorable) | | Rate |
| Mexican peso / U.S. dollar exchange rate: | | | | | | | | | | | | | | |
| End-of-period | | 19.7 | | | 5 | % | | | 20.7 | | | (20 | )% | | | 17.2 |
| Twelve months ended | | 18.9 | | | (1 | )% | | | 18.7 | | | (18 | )% | | | 15.8 |
| | | | | | | | | | | | | | | |
| Guatemalan quetzal / U.S. dollar exchange rate: | | | | | | | | | | | | | | |
| End-of-period | | 7.3 | | | 3 | % | | | 7.5 | | | 1 | % | | | 7.6 |
| Twelve months ended | | 7.4 | | | 3 | % | | | 7.6 | | | 1 | % | | | 7.7 |
The following table presents segment revenues of the Latin America operations segment for the fiscal year ended December 31, 2017 as compared to the fiscal year ended December 31, 2016 on both a GAAP and non-GAAP constant currency basis (unaudited, dollars in thousands):
|
| | | | | | | | | | | | | | | | | | | | | | |
| | | | | | | | | | | Constant Currency Basis |
| | | | | | | | | Year Ended | | |
| | | | | | | | | December 31, | | Increase / |
| | | Year Ended December 31, | | Increase / | | 2017 | | (Decrease) |
| | | 2017 | | 2016 | | (Decrease) | | (Non-GAAP) | | (Non-GAAP) |
| Latin America Operations Segment | | | | | | | | | | | | | | |
| Revenue: | | | | | | | | | | | | | | |
| Retail merchandise sales | | $ | 333,609 |
| | $ | 283,105 |
| | | 18 | % | | | $ | 338,009 |
| | | 19 | % | |
| Pawn loan fees | | 130,309 |
| | 116,874 |
| | | 11 | % | | | 131,972 |
| | | 13 | % | |
| Wholesale scrap jewelry sales | | 21,645 |
| | 14,958 |
| | | 45 | % | | | 21,645 |
| | | 45 | % | |
| Consumer loan and credit services fees | | 1,767 |
| | 1,929 |
| | | (8 | )% | | | 1,793 |
| | | (7 | )% | |
| Total revenue | | 487,330 |
| | 416,866 |
| | | 17 | % | | | 493,419 |
| | | 18 | % | |